How 40 Lines of Code Improved Our React App’s Performance by 70%

On Appsmith, developers can quickly build any custom business software with pre-built UI widgets that connect to any data source. These widgets can be controlled with JavaScript. We created this framework to help developers save on valuable time building complex applications for internal uses within their organizations. For this to work for everyone, we believe that the core parts of Appsmith need to run smoothly and should be continuously improved. Appsmith’s UI is built using React, Redux, Web Workers, Immer among other things. In this blog, Sathish Gandham, a frontend engineer focusing on UI performance at Appsmith, will talk about how we improved the editing experience on Appsmith.
What is the Editing Experience on Appsmith?
The editing experience on Appsmith involves writing bits of code to customize the functionality of the widgets and writing special commands and actions into the application. It is a crucial function in the Appsmith framework.
Lag and Delay
Building an application on Appsmith involves dragging and dropping widgets onto the canvas and writing custom code on the editor; however, we noticed that while editing text/code in the canvas, the editor would often freeze, resulting in a less than optimal user experience. When building an application, there should be no delay or lag. This was a huge issue that needed our immediate attention from an engineering perspective. For a natural typing experience, users want the keypress latency to be under 100ms, though 50ms would be ideal.
To solve this problem, we needed to understand what happens when a user types. For this, we used:
React profiler: This measures how often components in the application render and the “cost” of rendering. The profiler helps in identifying parts of an application that are slow. In our case, this allowed us to understand what components were rendered as we typed.
Chrome Performance tools: This helped us quantify the problem, measure our progress, find the code taking longer to execute, and find unnecessary repaints.
Please note that the React profiler is part of the React Developer tools browser add-on which is available for Chrome and Firefox.
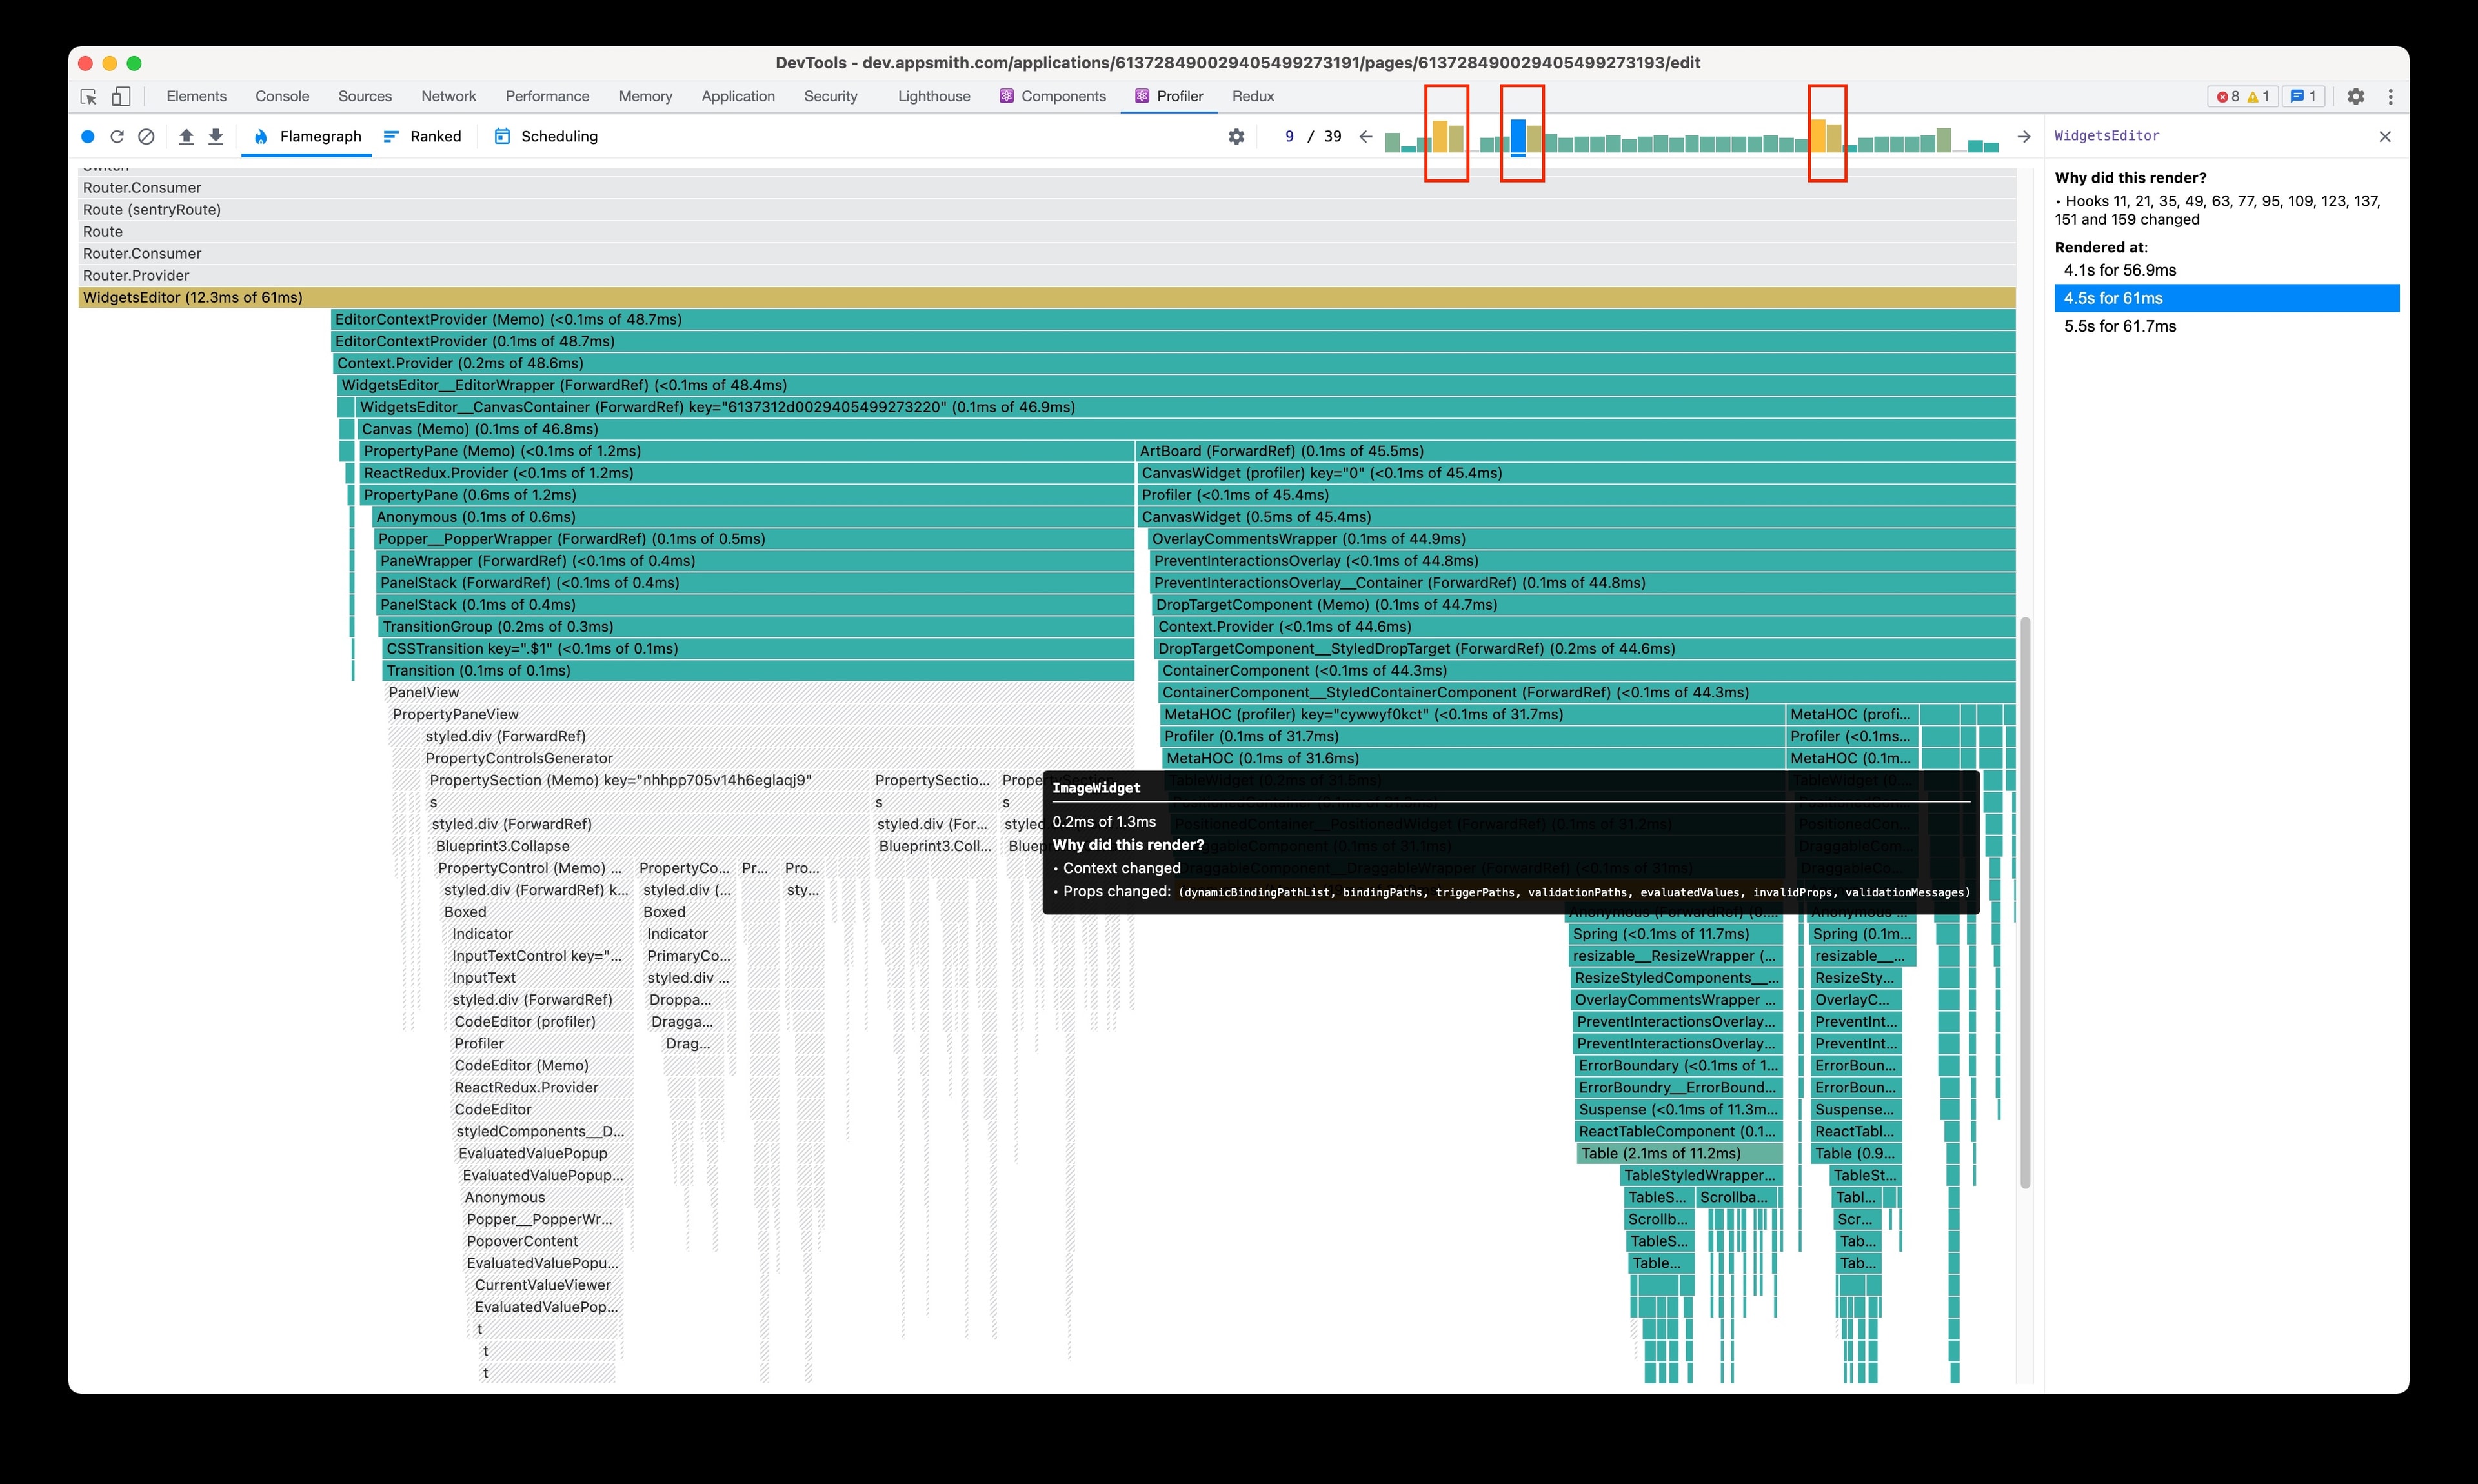

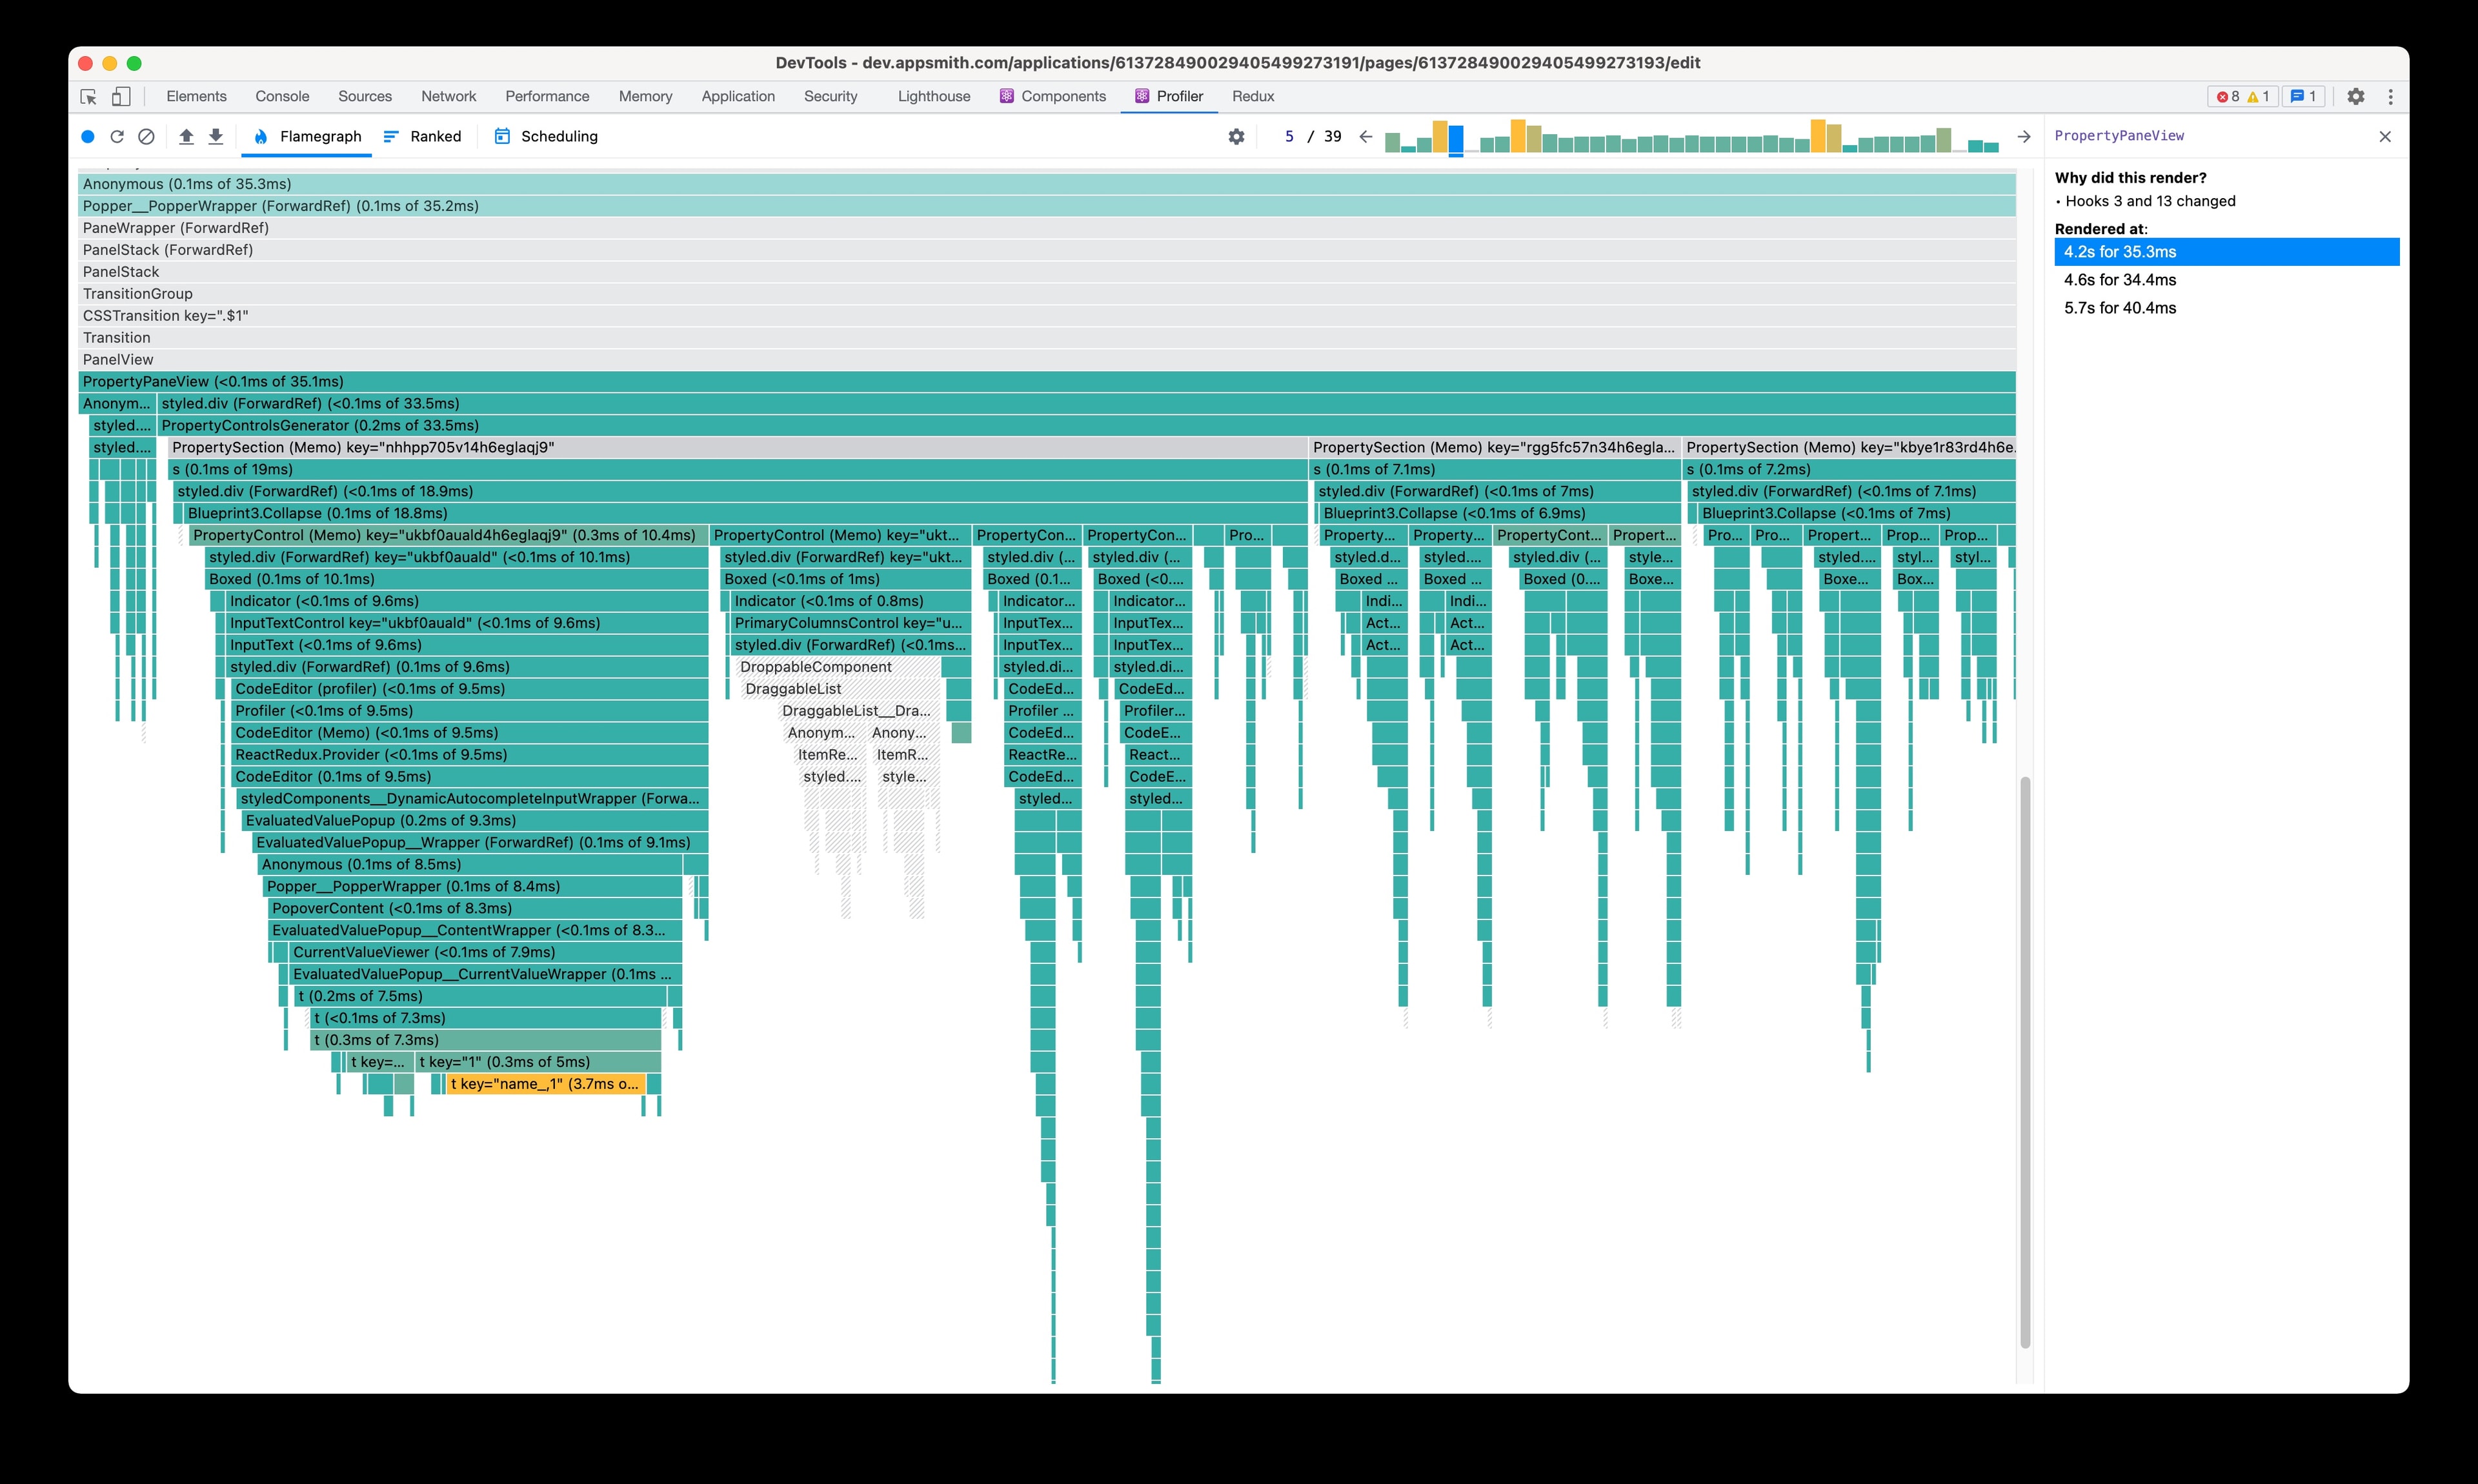
From the React profiler, we see three pairs of long commits; each of these corresponds to the following property pane, and UI widget renders. Ideally, the property pane should render much faster than the canvas since there is nothing changing in the property pane except the input we are editing. Even the canvas should be rendering the widgets currently in use and not the rest. We realized that this was not the case and needed to be fixed.
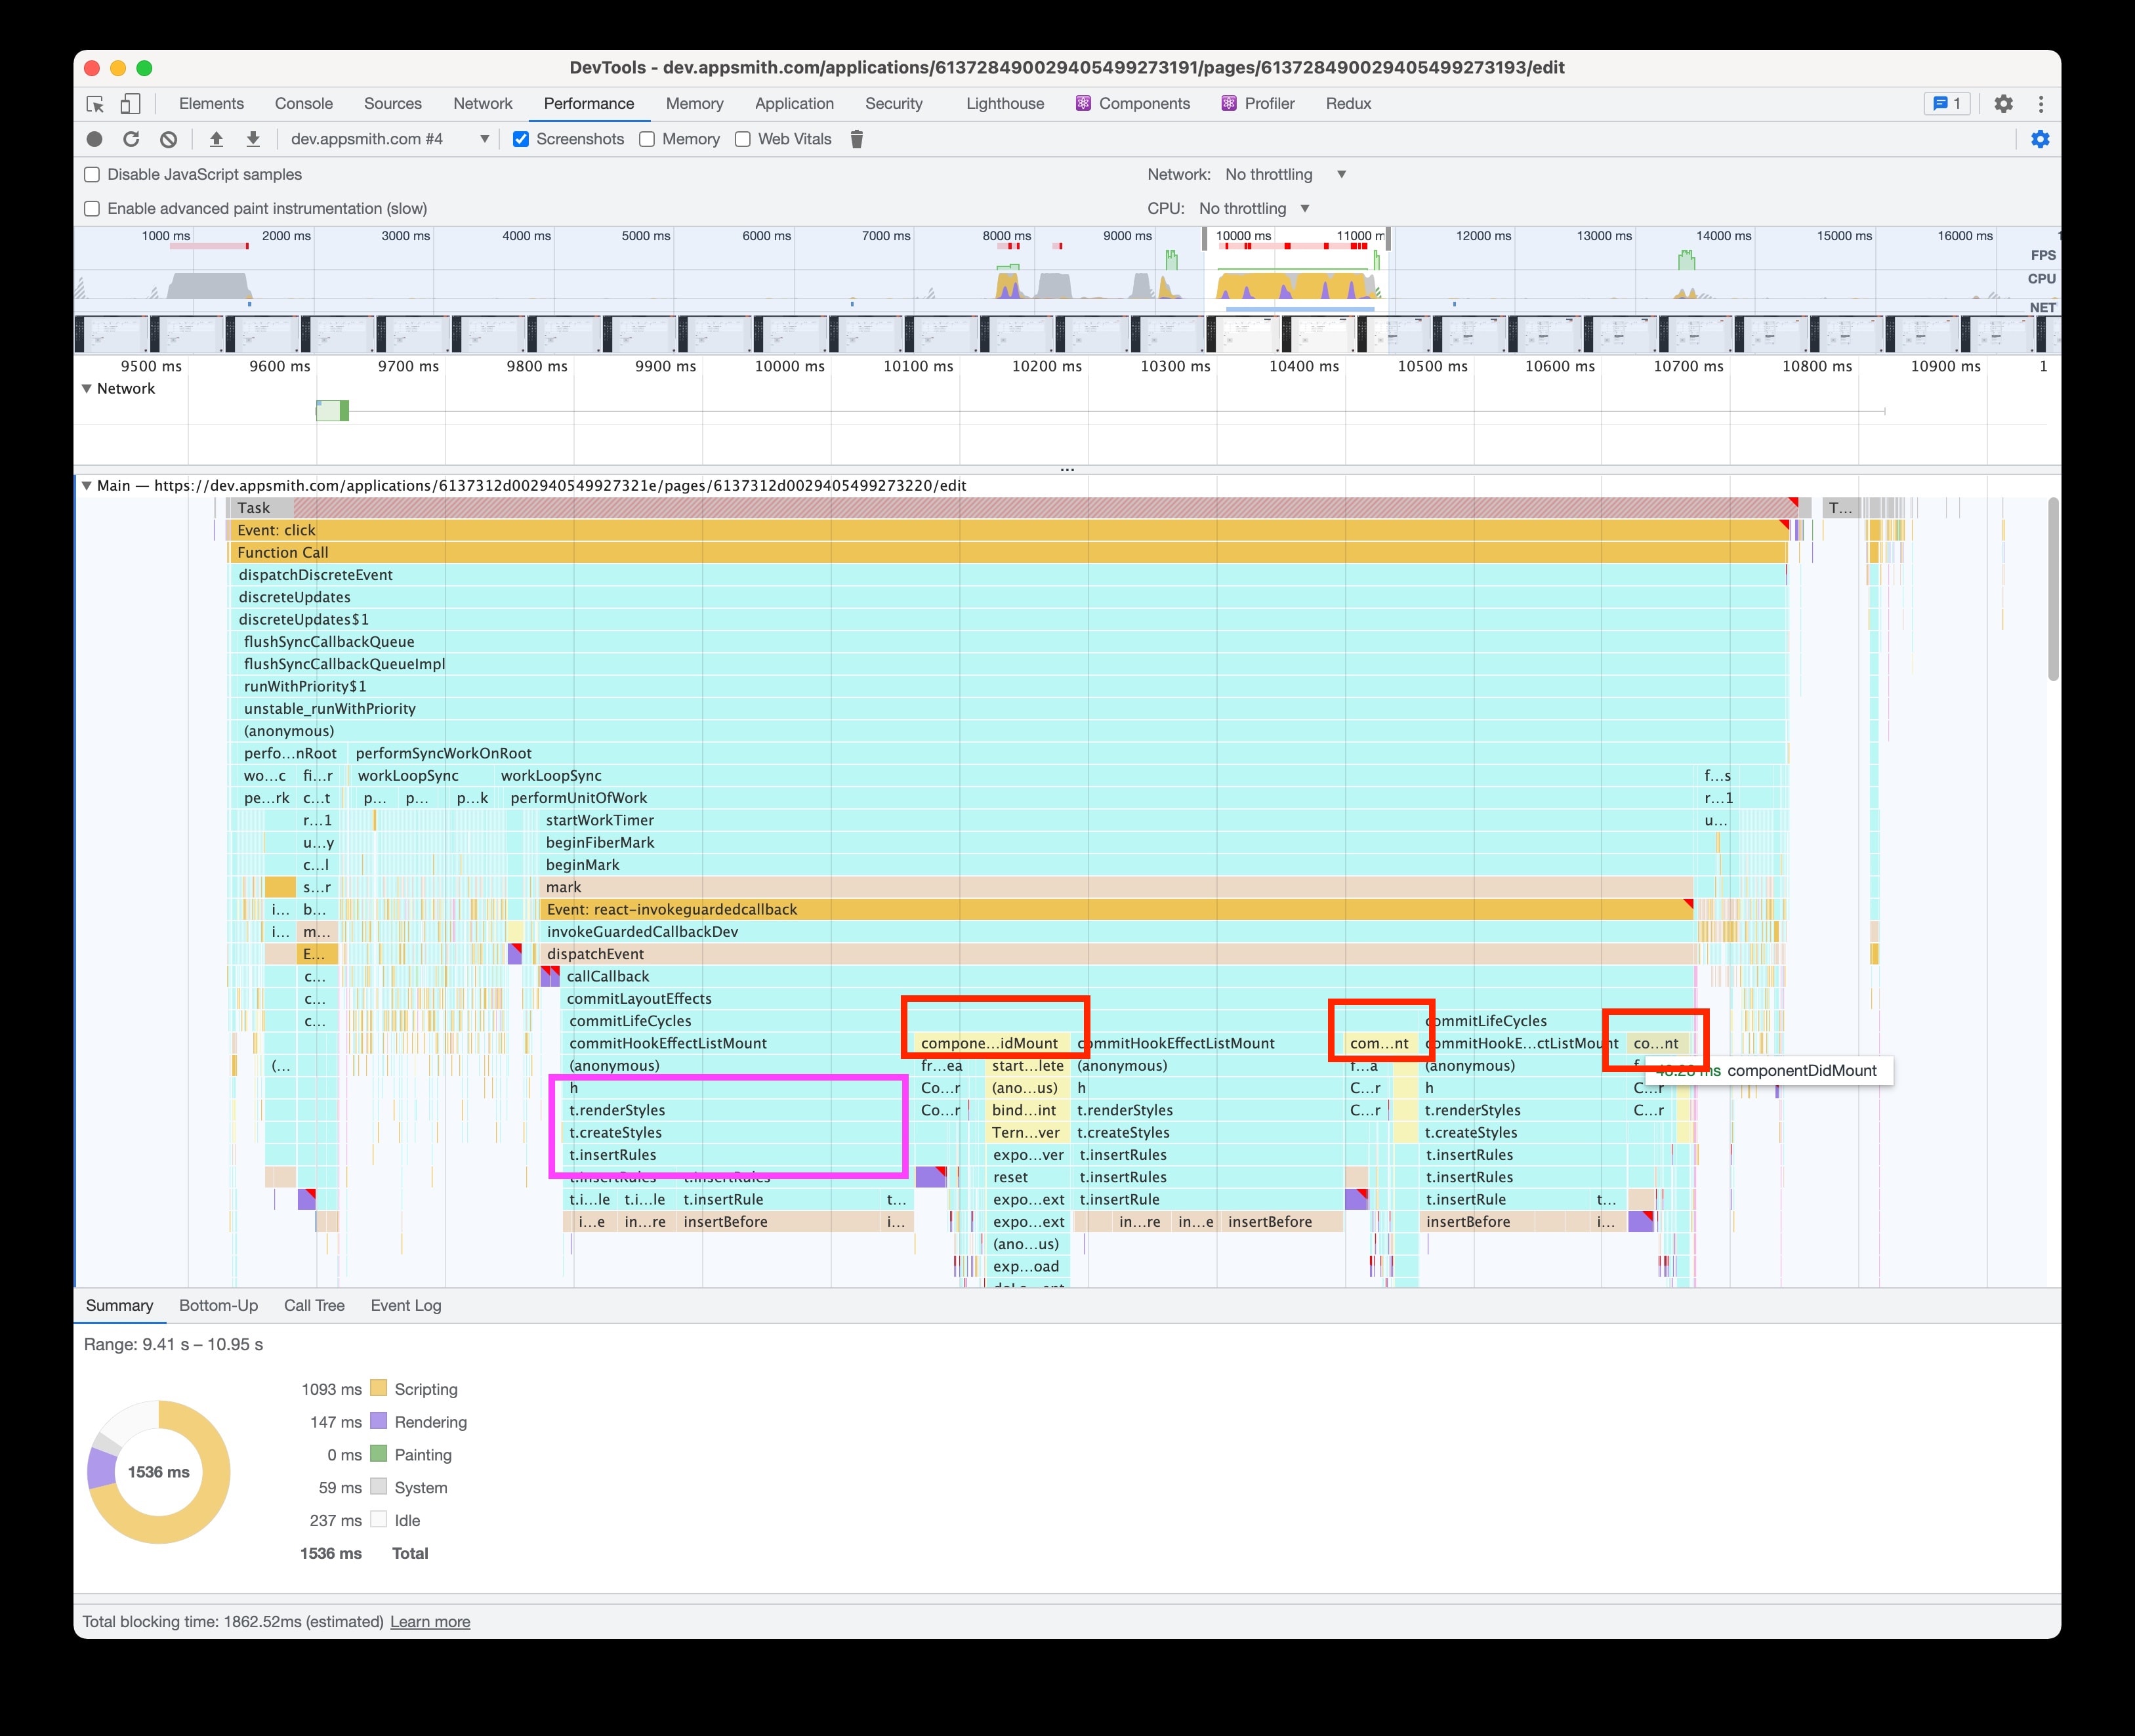
We profiled the property pane issue in isolation to identify what it takes to render it. For this, we used the performance tab in Chrome DevTools to see what happens when the property pane opens. This gives us some helpful information.
ComponentDidMount of code editor is taking a lot of time
Styles are also taking a long time to render
Here’s how we listed the tasks that lay ahead of us:
Identify as to why all the widgets were rendering when they don’t have to and fix it
Optimize the code editor [Not apparent from the React profiles]
Identify why all the controls in the property pane are rendering and fix it
Optimize the global styles
Optimize the evaluatedvalue pop-up
In this blog, I will talk about how we went about the first task. Before I get to that, here are a few tips for profiling:
Try to split your problem into smaller pieces and profile them. With this, you won’t crowd your profile, and you can find the performance issues with ease.
Example 1: To improve the editing experience, we just profiled a single keypress.
Example 2: To profile a drag and drop action, we can split that into drag start, move, and drop.
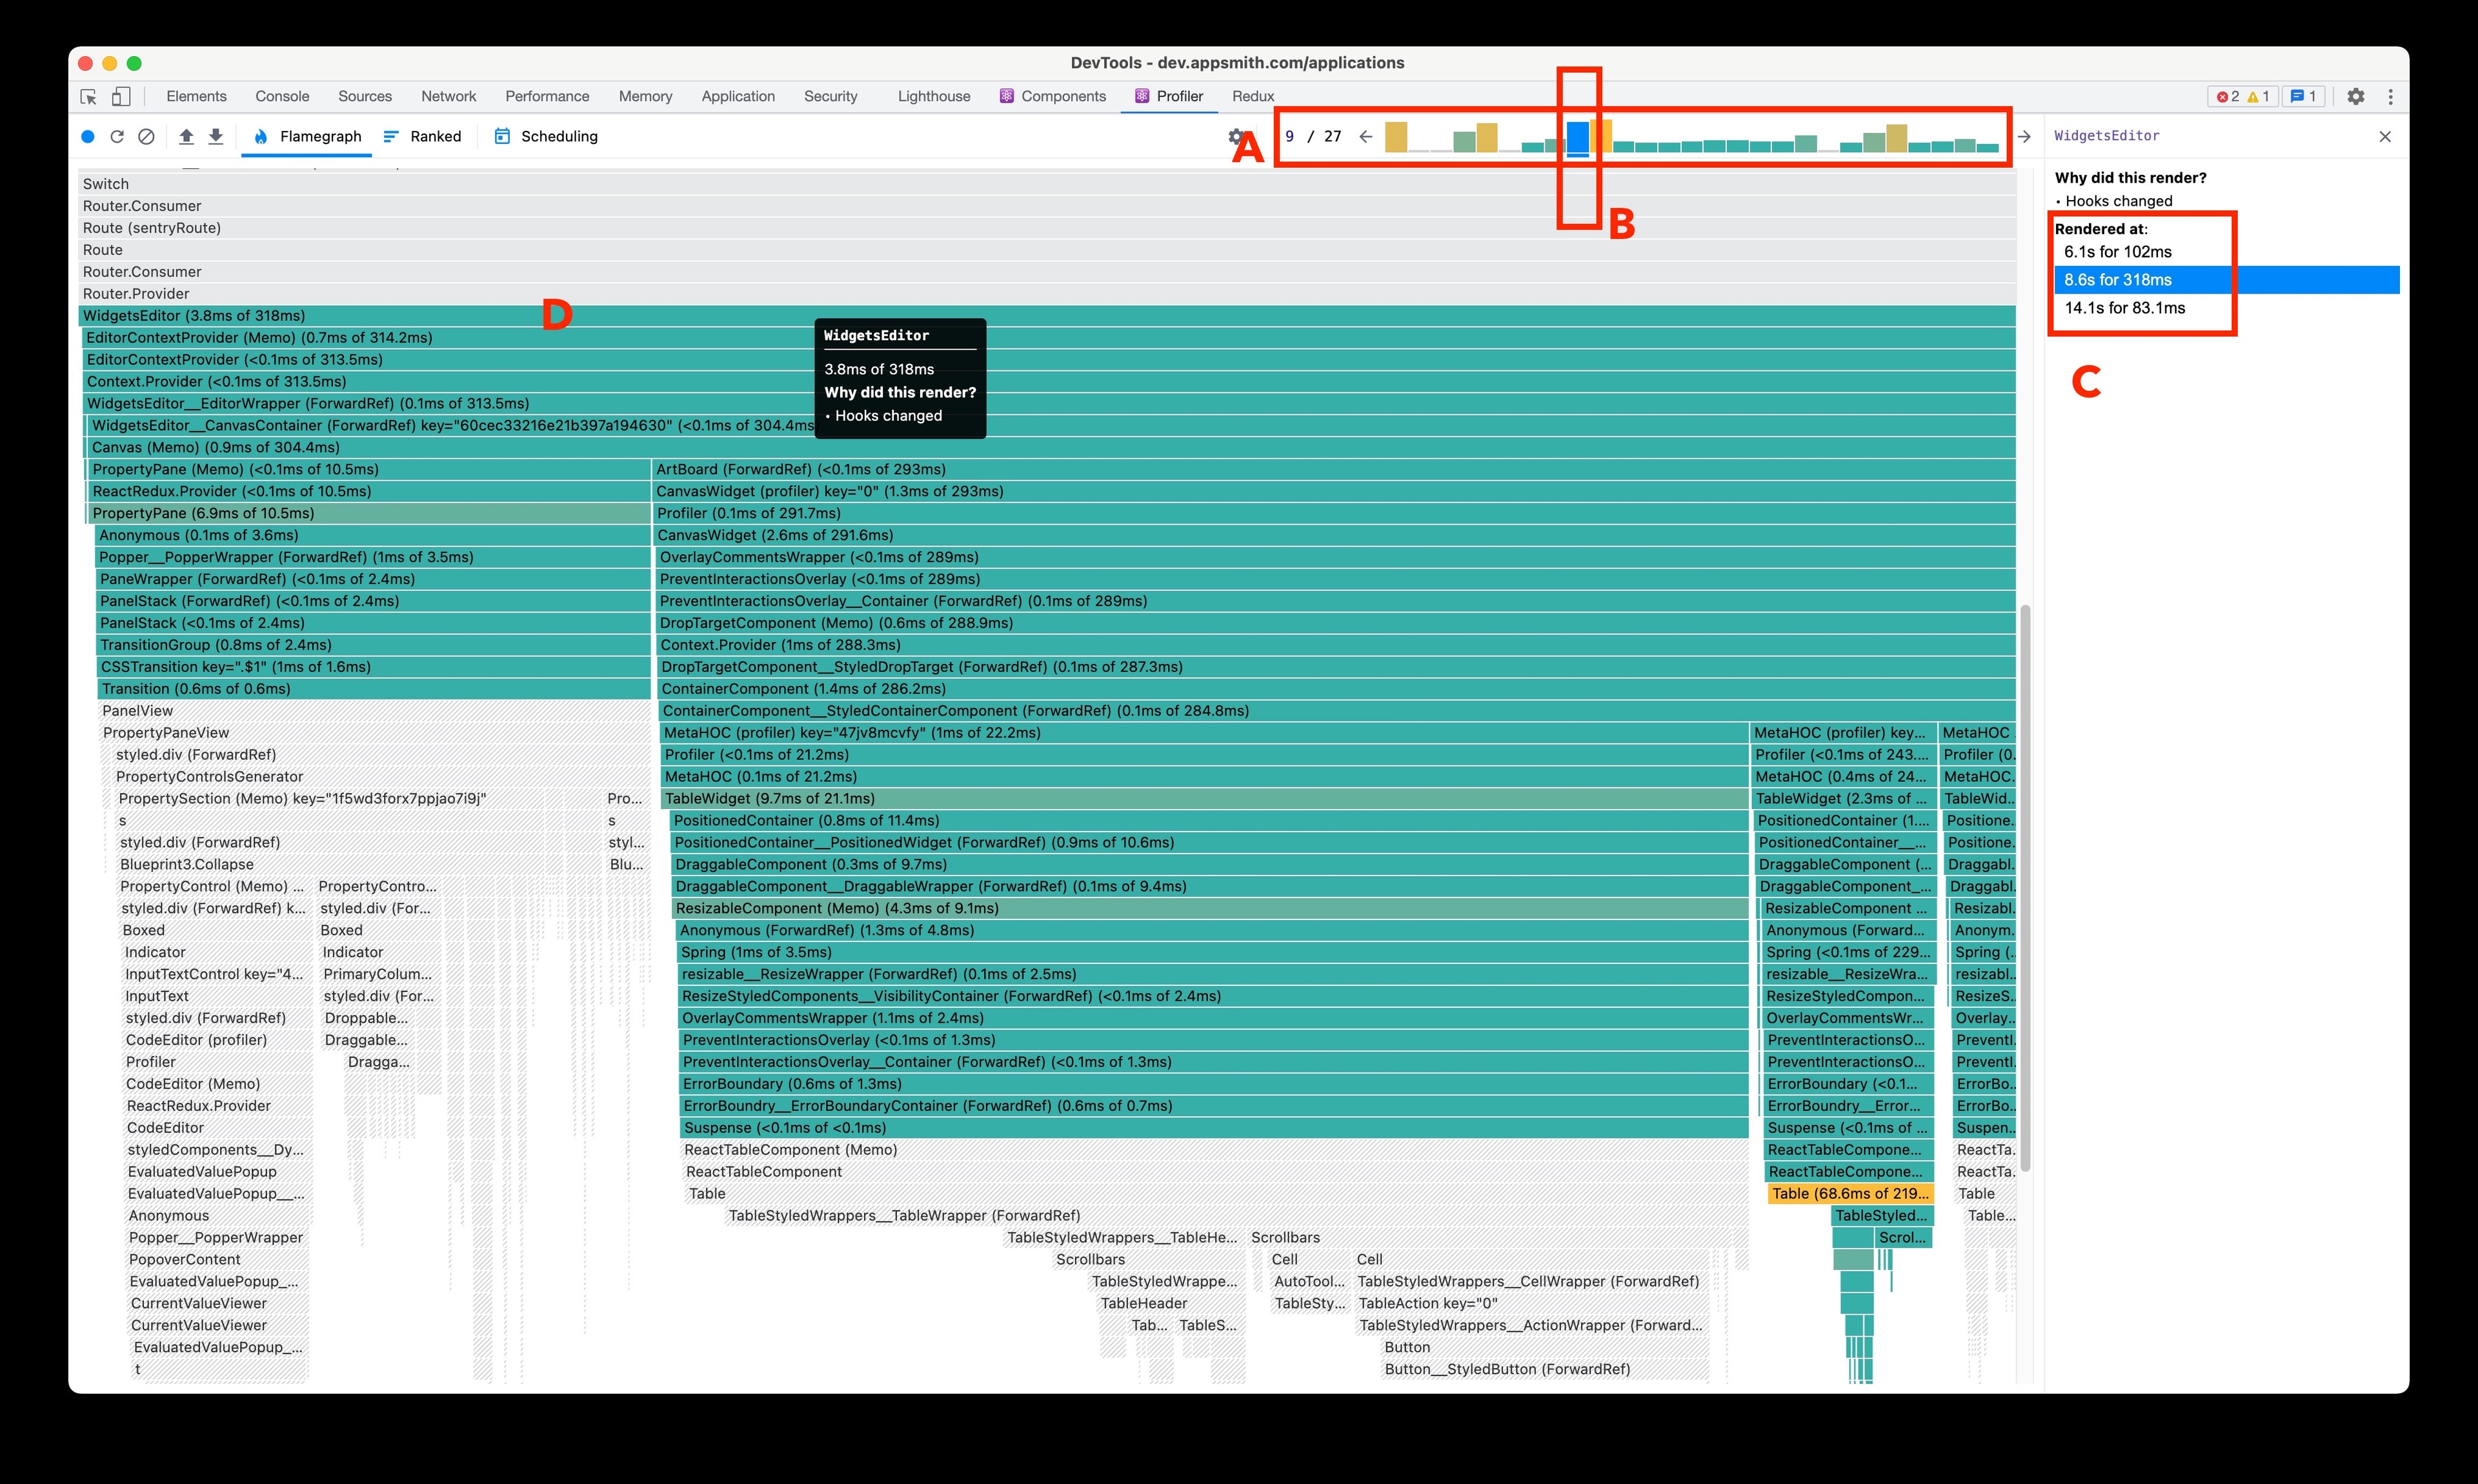
Leave the application idle for 5 seconds after starting the profile and before stopping it. It will make it very easy to identify the work that has been done. [See A & C From profile above]
To measure the overall performance improvements, instead of measuring each optimization individually, it’s better to consider focussing on the overall scripting and time taken to render during an action. You can get this number from the chrome performance tab. [B & D from profile above]
In the React profiler, don’t just focus on the large commits. Go through each commit at least once, and see what’s getting rendered in that commit. The chances are that one or two small components are accounting for all those renders.
Here’s a short guide on reading the React profile:
A: List of commits during our profile
B: The commit we are looking at
C: Details about the selected component (WidgetsEditor). Our widgets editor rendered three times during the profile at 6.1s, 8.6s, and 14.1s. 102ms, 328ms,83.1ms is the duration each commit took; it is not the total time the selected component took to render.
D: Zoomed in view on the component we selected and its children.
Here are the notes on the profile based on which we worked on improving the editing experience. You can download the attached profile and import it in your React profiler to follow along or just refer to the image above.
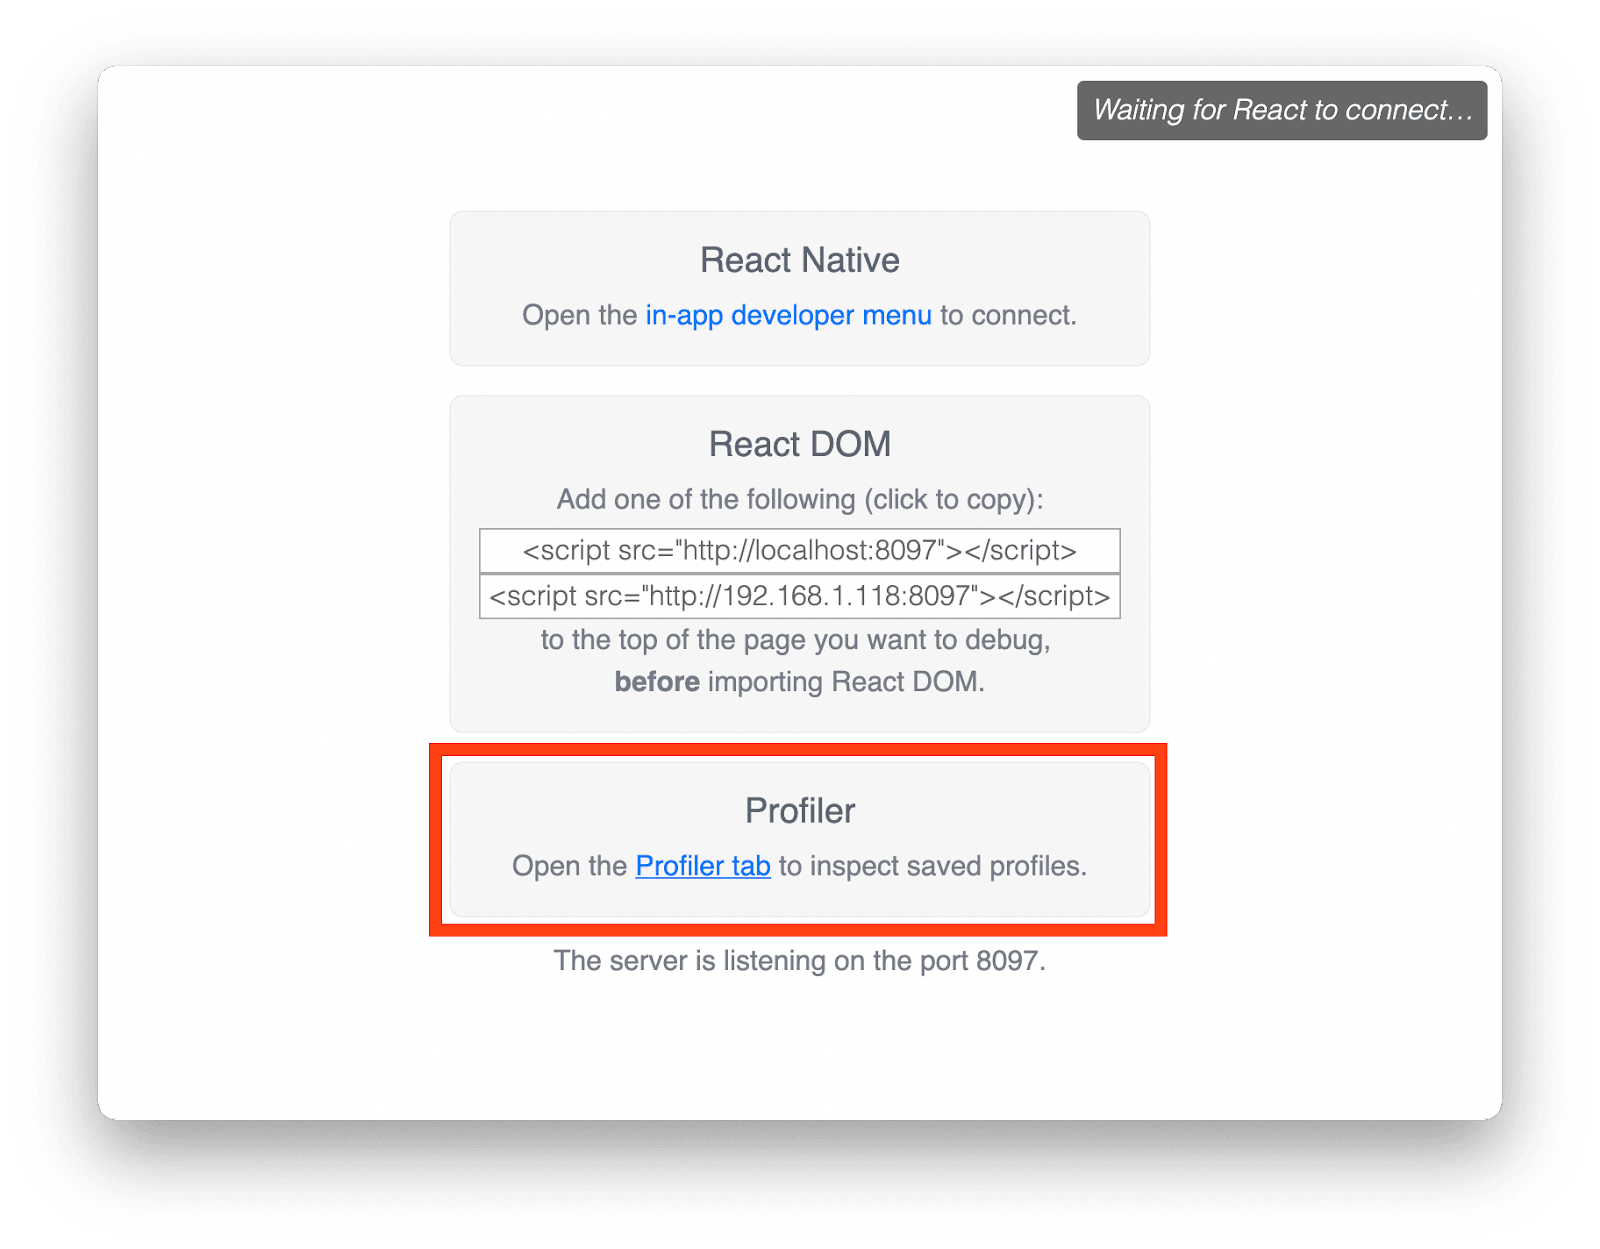
Please note that the React profiler is available only when you open a react app in dev mode in Chrome/Firefox, if you don’t have a local React development set up, you can use the standalone React developer tools to read the profile.
Here are instructions on how to install it and start it:
Install # Yarn
yarn global add react-devtools
# NPM
npm install -g react-devtools
Run
react-devtools
Follow this link to read the detailed notes from the profile we did to improve the editing experience on Appsmith.
I’ve put some notes here for your reference:
1. Evaluated value opening. Not related to editing.
2. Widgets editor, not sure why.
3. Editor focused. We should be able to avoid the rest of the property pane from rendering.
4. Small changes to property pane, its header, lightning menu, and action creator. Nothing changes for them, so they should not be re-rendering. Memoization can help here.
5. Same as above.
6. We get the evaluated value back. Entire widgets editor is re-rendered (Deduced this from one of the two updates to table), we can optimise this
- If each widget subscribes to its data independently, we should be able to avoid the unnecessary renders of the widgets by
- Doing a deep check at the widget level
- update the store with only values that changed.
7. PropertyPane is rendered with the updated value. EvaluatedValue taking most of the time.
8. From 8 to 17, these are commits like 4 & 5 above.
9. 18 & 19 are widgets editor and property pane. I don’t see why these are required. I will look into it.
Widgets Render When Not Needed
One of the most loved features of Appsmith is reactive updates. With reactive updates, you can see the widget change and show data. With traditional programming, you would have to reload the page in order to see the update in the widget. This is achieved by updating the data tree as and when you change something on the canvas and using the updated data tree to re-render the app. Due to the amount of data we have and the number of calculations we need to do, it took a long time and blocked the main thread.
To solve this problem, we moved the evaluations to a web worker freeing the main thread. A brilliant move to solve the problem at hand, but this created a new issue. The problem here was due to object reference changing. Since the data tree is coming from the worker, we would always get a new reference for every item in the tree even though only some of them changed. This reference change was making all the widgets re-render unnecessarily.
A few approaches we tried to solve this problem were:
Get what keys changed from the worker (worker has this information) and update only those values in the reducer. This did not work because the list of keys was not complete.
Compute the diffs between the current data tree and the one received from the worker and update only what changed. Though this prevented the renders, we did not improve the overall scripting time we measured earlier. The reason is, computing the diffs itself took a lot of time, which would happen twice for each change.
Web Worker to the Rescue
We moved the task of computing the diffs to the worker and used the deep-diff library to compute the diffs and let immer take care of immutability.
This helped us in two ways:
Offloaded the expensive task of computing the diffs on the main thread.
Reduced the size of the data we transfer between worker and the main thread (this was never a bottleneck for us, though).
This change alone brought down the keypress latency by half.
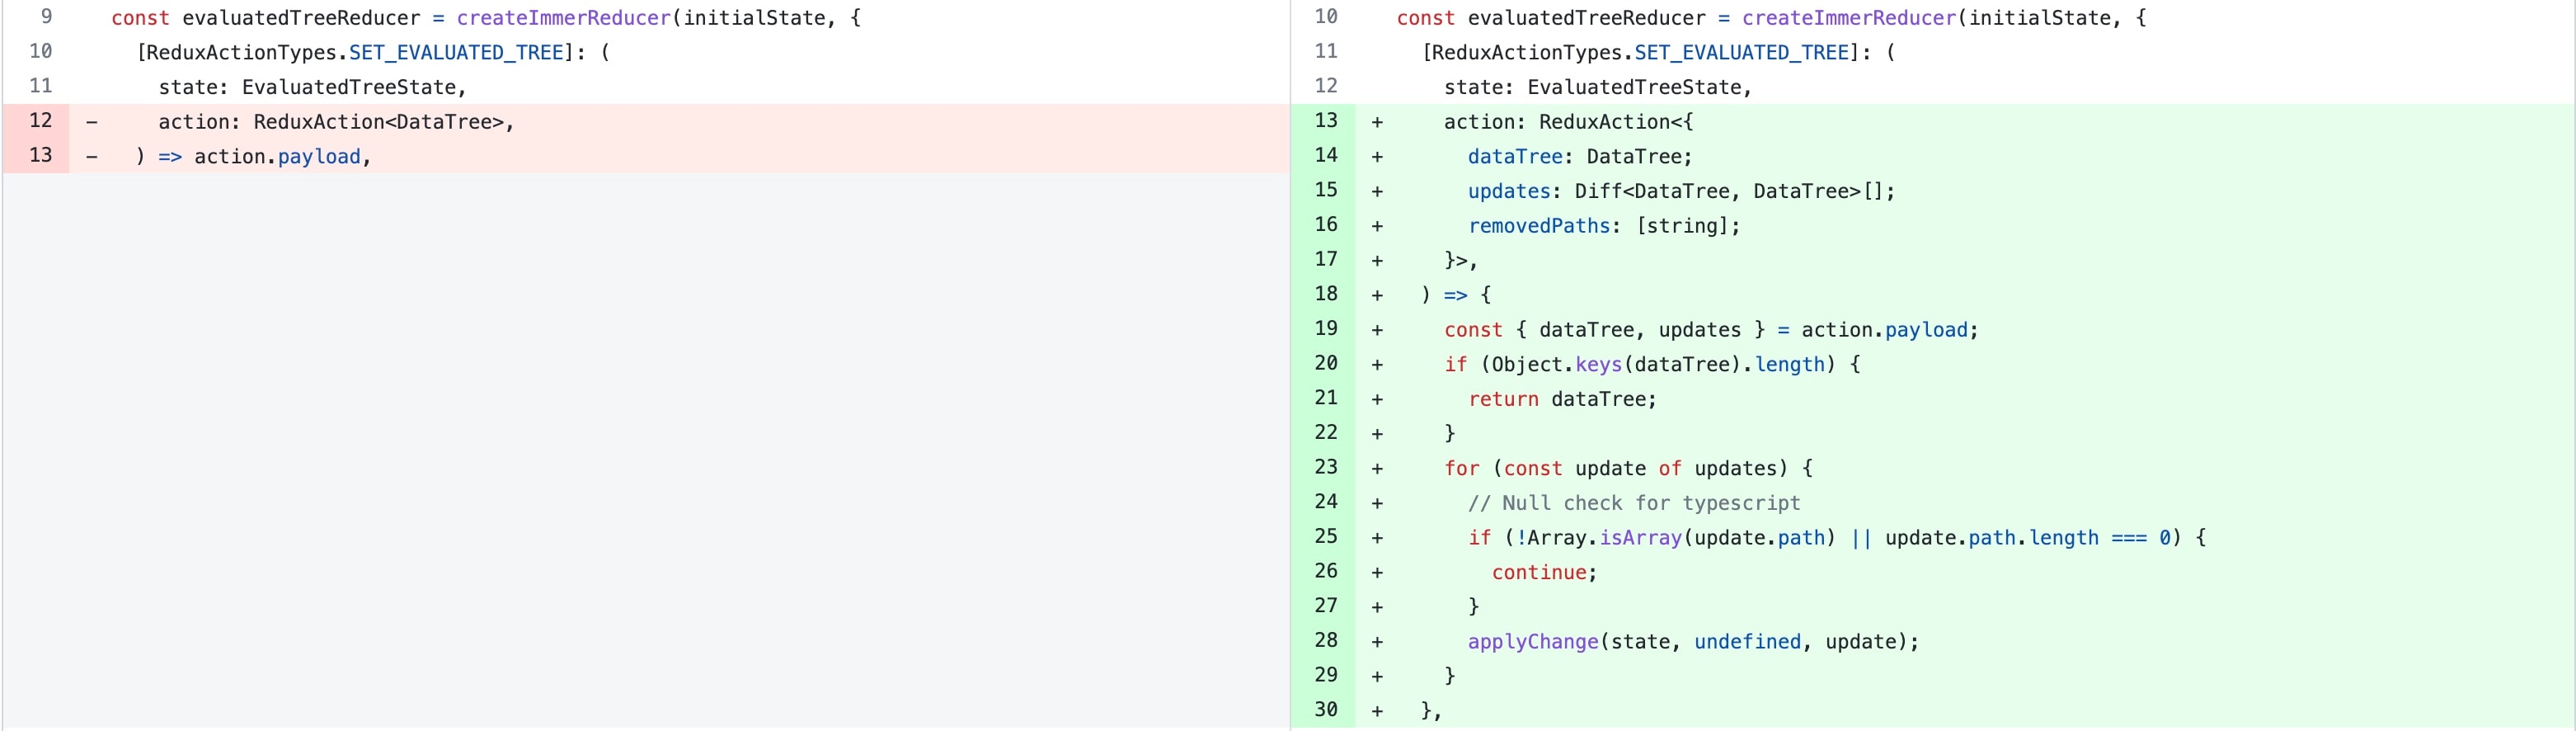
Instead of replacing the entire data tree from the worker, we get the only changes (updates) and apply them to the current state. applyChanges is a utility method from deep-diff. Immer takes care of the immutability.
If there’s anything to be said about performance improvement, it’s this, don’t take performance for granted and profile your code on a regular basis. Even a few lines of change or configuration can lead to a great performance gain.
I hope you found this blog helpful. If you’d like to get in touch with Satish, ping him on Discord or visit his website.