How We Screwed Up Debugging (and What We're Doing About It)

The debugging experience is extremely important for any development tool, from frameworks and IDEs to internal tools platforms like Appsmith. No code is perfect the first time around, so for development platforms, the debugging experience often is the user experience — it makes a massive difference if errors are not crystal clear or developers have to jump back and forth to debug an issue.
But there was a large gap between the debugging experience with Appsmith and what we wanted it to be. In this article, I discuss how we’ve thought about these issues at Appsmith, the changes we’ve made to address them, and our future plans to further improve the debugging experience in Appsmith’s internal app studio.
Defining the problem — how we were getting debugging all wrong
Despite debugging being vital to the development process, most development tools do not place nearly enough focus on the debugging experience — and that included us at Appsmith. We allowed some common shortfalls in our debugging paradigms and tools to remain from early production and become part of our product. The most impactful of these were the lack of a common language for developers to communicate errors, UI components that didn’t make it obvious when there is an error, and error logs that didn’t help users resolve their errors quickly enough on their own.
These shortcomings often resulted in developers calling Appsmith’s customer support to try to resolve their issues. We truly love interacting with our users, but this is very inefficient for most developers. Developers want the ability to quickly unblock themselves rather than wait for support to get back to them. To facilitate this, we want debugging in Appsmith to be a seamless, efficient process: it must be obvious that there is an error, the error details should contain all of the relevant information about its location and cause, and we should, wherever possible, provide the steps that can be taken to fix it.
Understanding the magnitude of the problem
In order to improve the debugging experience in Appsmith, we needed to understand the outcomes that the existing solution was producing. We did this by consulting our users and examining usage data to get an idea for the specific workflow on a typical error.
After analyzing this data, we found that all errors could be broken down into the following four categories:
- Validation errors: when data is passed in an unexpected format to a widget — for example, passing a JSON object to the text field of the label widget when it expects a string.
- Parsing errors: when JavaScript code cannot be evaluated because of syntax or runtime errors — for example, trying to reference a property of a null JavaScript object.
- Linting errors: when the JavaScript linter catches syntax errors before execution, such as missing parentheses.
- Action/plugin execution errors: when the execution of a defined action has errors, such as a failed connection to a data source.
After categorizing all errors in this manner, we had a good understanding of what the most common error types on the platform were. We could therefore prioritize our efforts to improve the overall debugging experience, focusing first on the error types that would benefit our users the most.
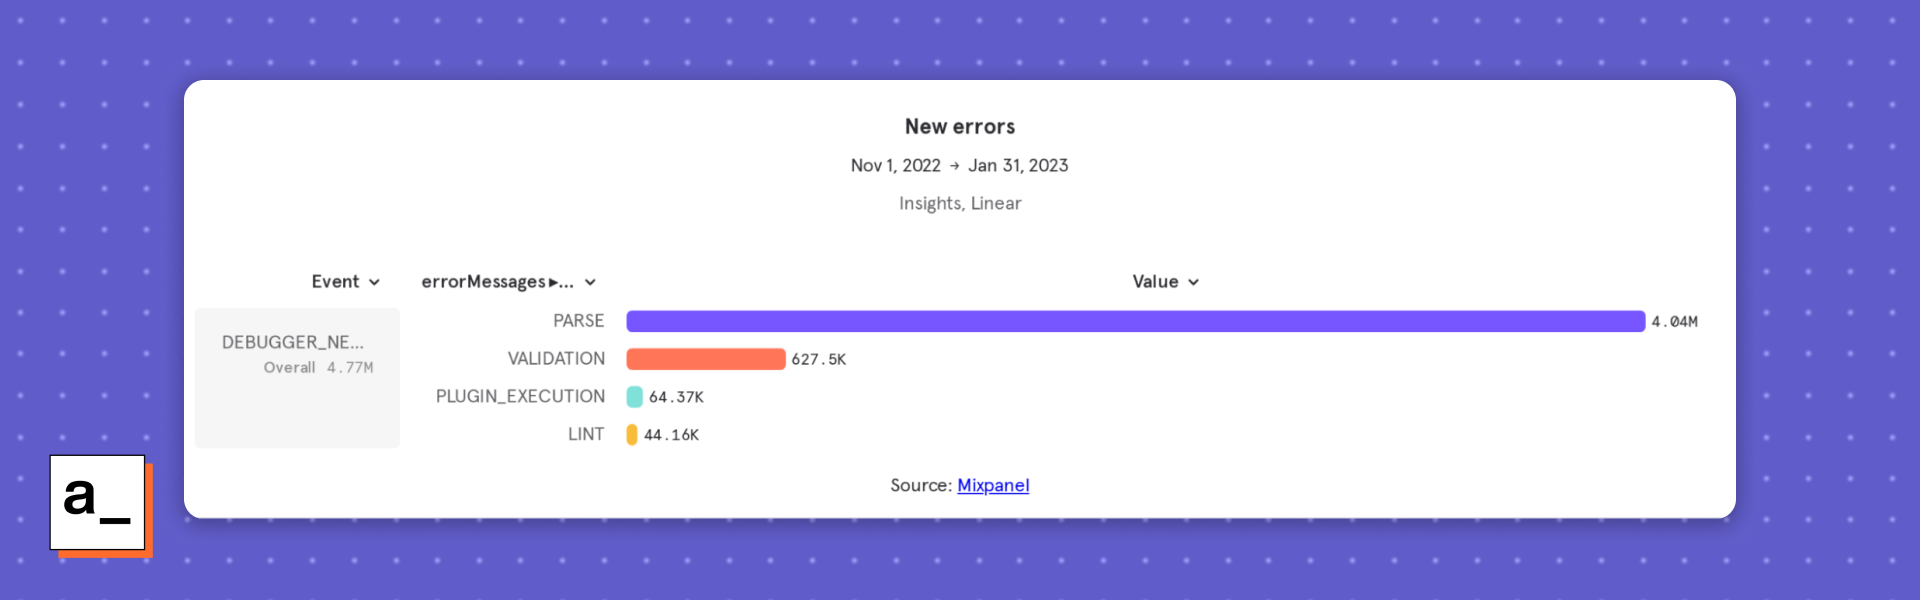
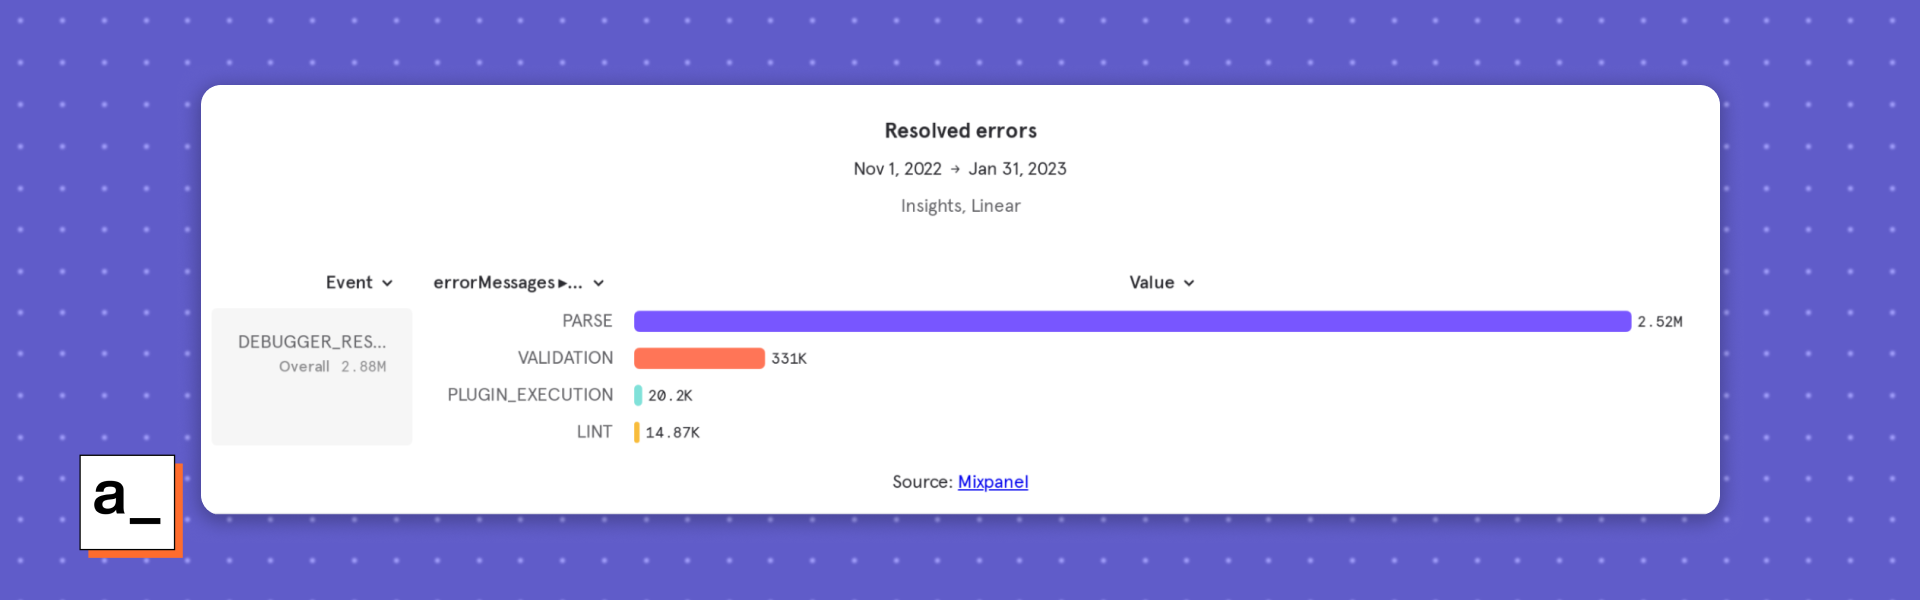
Our first insight was that parsing errors were the most common type of error by far, followed by validation errors, and then plugin and linting errors. We also captured data for the resolution percentage for all of the error types that we could. We found that while the resolution rates weren’t terrible, there was a lot of room for improvement. This lined up well with the feedback that we had received and our more qualitative assessment of the path that a user typically takes when debugging on Appsmith.
Finding a solution — how can we make debugging more useful and less frustrating?
Our goal is simple: increase the percentage of errors solved, while decreasing the average time that users spend resolving them. Unfortunately, reaching this goal is much more complex than the mission statement suggests. We had to take a deep dive into how our users were building their apps and debugging their errors on the platform to understand each step in the process and how we could tweak it.
Defining success
First, we had to understand the gap between Appsmith’s existing debugging experience and the ideal scenario — for both ourselves and end users. We needed to know what success would look like. We did this by putting ourselves in the end user’s shoes and asking ourselves what we’d most like to see when we use Appsmith to build applications ourselves.
We found it helpful to think of error handling as a three-step process:
- Discovery: when the user becomes aware that there is an error
- Redirection: when the user is moved to a location that will help them resolve the error
- Error logging: when they work in the location with the specific information they need to resolve the error
This mental model helped us better conceptualize the debugging process and what the job was at each specific step.
We also took inspiration from popular development tools like VS Code and GitHub Copilot that already solved this problem well. These tools make debugging as smooth and easy as possible by focusing on a few key principles:
- Making issues clear: making it obvious that there is an error with persistent eye-catching notifications
- Directing users’ focus: making it easy to move to the more detailed information when required, so users only need to focus on the most important things at any given time
- Cutting down cognitive load: only showing the most relevant information to avoid information overload
On our mission to make debugging better, we needed to apply these principles to our solution — closing the gap so that users would be as comfortable developing in Appsmith as they would be in their favorite IDE.
Planning and setting milestones
Now that we knew where Appsmith was lacking and how these issues were already being solved by existing tools, we identified the specific features within Appsmith that could improve each step of the debugging process:
- For discovery, it often wasn’t clear enough that there was an error.
- For redirection, the path to move from the editor to the error log with more detailed information wasn’t clear enough.
- For error logging, the information often wasn’t helpful enough to a user who was trying to debug their issue.
We had to work on the three-step process backwards. It wouldn’t do any good to improve discovery and redirection if the information in the error log itself didn’t help! So we put all of our early efforts towards improving the detailed information in the error log.
The first step to better debugging — fixing the error log itself
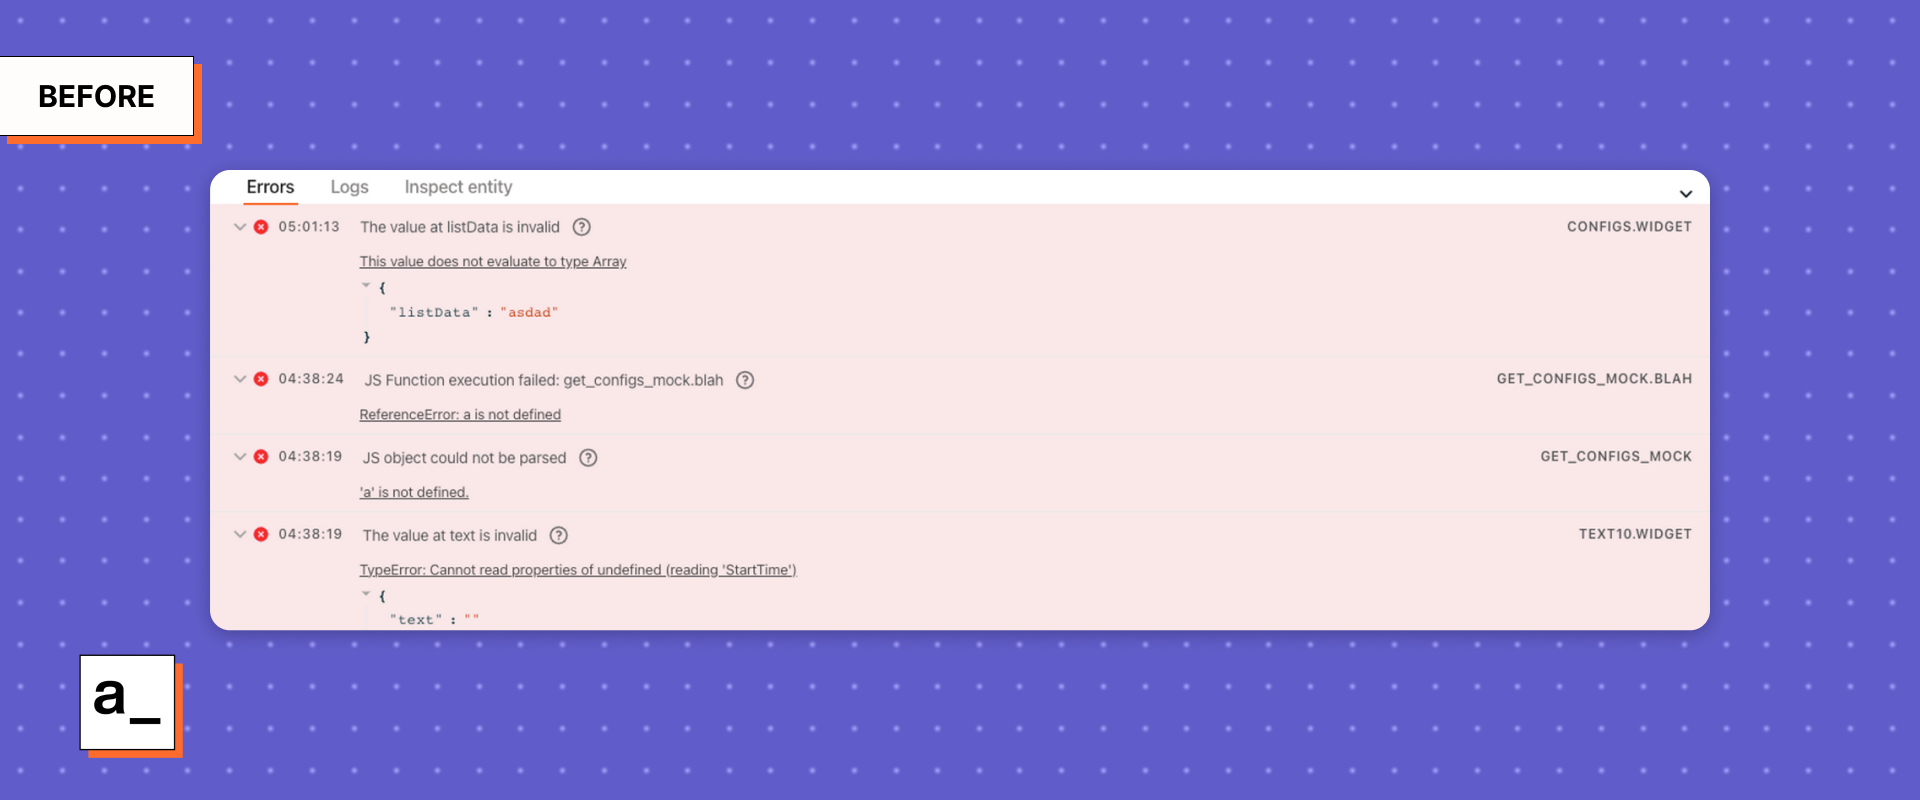
To improve our error logging, we needed to fix the following problems: lack of a standardized error format, poor readability (for example, certain links didn’t look like links), and unclear presentation of the next steps for resolving an error.
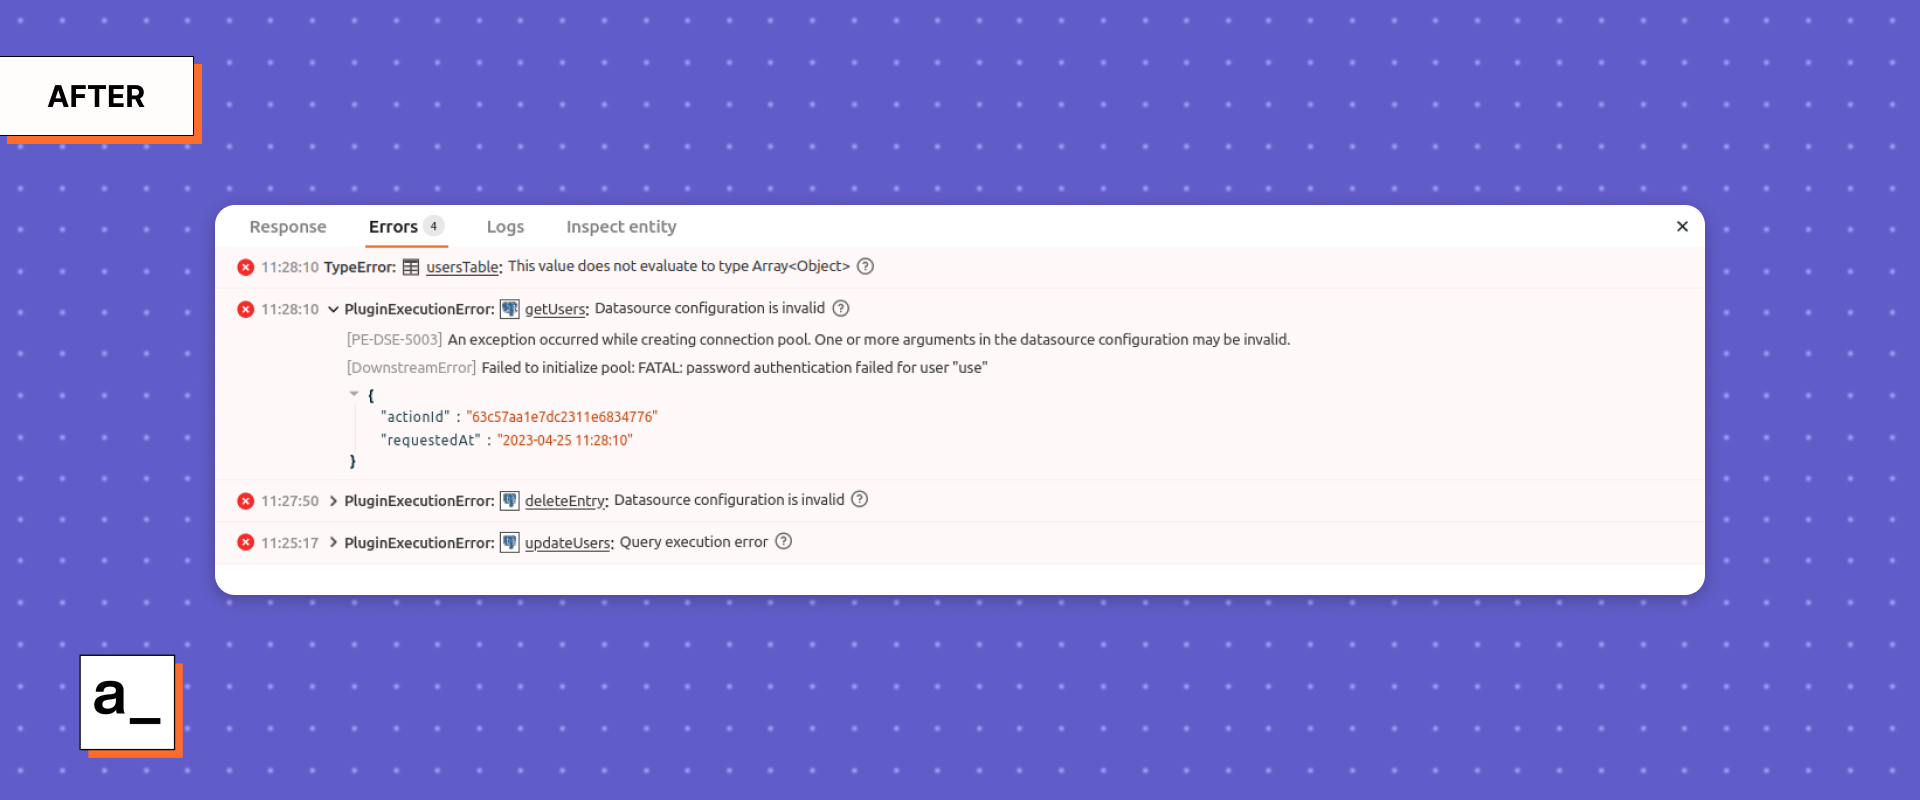
First, we implemented a common schema for all errors using alphanumeric strings and more detailed text to give a standard “look and feel” for errors to our end users. We took inspiration from HTTP status codes — a standardized response format that gives engineers and end users on the web a common language to communicate and understand their errors. We wanted this concept in Appsmith because it helps to clarify what the exact issue is and makes it easy to communicate and search, so that engineers could find solutions on forums or in documentation.
Second, we made the log entries as compact as possible by only showing the bare minimum required information. Previously, different errors took up several lines and jumped into various technical details right away. Now, each error takes up one line with the minimum information needed for users to understand what happened. If users want more detailed information, they can click the dropdown button to see more detailed information relating to the error. This reduced the cognitive load so that users would not be hit with a wall of text while debugging.
And third, we made sure to include only the relevant specifics that would be most helpful for the different error types. For example, with validation errors, it was helpful to show the data structure passed vs. expected to understand the exact difference. With linting errors, we added clear line numbers, which is something we lacked before. For parsing and plugin execution errors, we presented the exact error from the source, whether it was JavaScript, a database, or something else. These changes allowed users to focus on only the most important information on each issue.
None of these changes were particularly difficult to implement on a technical level, but they did require us to think carefully about the developer experience of debugging in much more detail than we had done previously. We also had to put a pause on the constant feature-addition mentality for a while and focus on the boring but important work of improving the experience we already had.
Better logging lets us do more with errors
Now that the error log makes problems more easily identifiable, we can focus more on the first two parts of our mental model – discovery and redirecting.
For discovery, we would like to standardize the pop-up messages users receive when an error occurs so that they are less jarring. We would also like to implement longer-lived messages in case users step away and miss an alert. Right now, it isn’t as obvious as we’d like it to be when there is an error that needs attention.
For redirection, we would like to implement a notification center to draw attention to the error log. We would also like to highlight specific entities — like widgets, queries, JS objects, etc. — in the editor to indicate that they are in an error state. It should be easy to click on where users need to go to see more information.
Work on our error logging tools — the third step in the process — is ongoing as well. First, we want to group cascading errors together to make the root cause more obvious. We’d also like to specify detailed information from the error log inline in the editor next to any components in an error state, to avoid the need to hop back and forth between the error log and editor entirely. And finally, we want to put more focus on solving the errors by automatically linking in the error log to the relevant Appsmith documentation or videos from the community with suggested steps to resolve the error.
Appsmith is progressing the developer experience. Want to help us out?
We’ve taken the first major step towards our ideal debugging experience, but there’s still a lot of work to be done. We’ve completed stage 1 — the difficult foundational work of categorizing all possible errors in our internal documentation and ensuring that they are communicated to users with more standardized error logging.
We are building on this by automating as many aspects of debugging as possible so that you can focus on building great apps. In stage 2, we will focus on better contextual messages for how to solve errors. And in stage 3, we will automatically take users to the screen to resolve their errors and make the presence of errors more obvious in the editor itself.
If you’re looking to contribute to our platform and debugging is important to you (or you have any ideas for how to improve debugging at Appsmith), please join our project — we welcome all suggestions and contributions!
Related Blog Posts