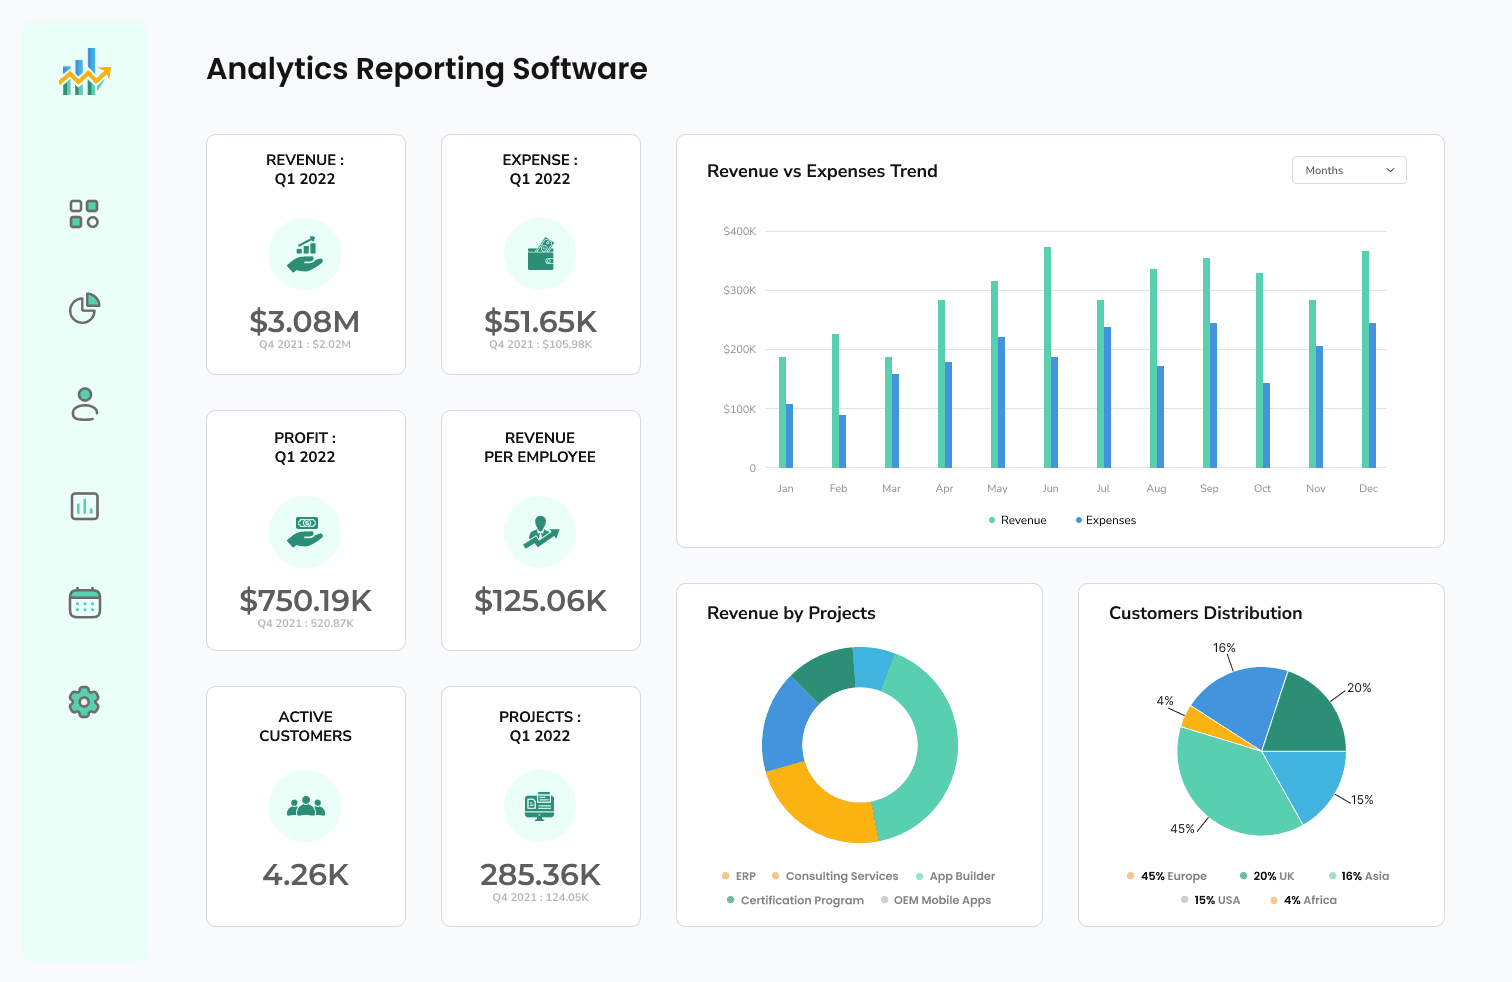
Build Powerful Analytics Reporting Software
Transform your data into actionable insights with custom analytics reporting software built on Appsmith in minutes.
FAQs
What are the common features of an Analytics reporting software?
What are the common features of an Analytics reporting software?
Analytics reporting software typically includes features like data visualization, real-time reporting, customizable dashboards, and data filtering. These tools help businesses make data-driven decisions by providing insights into their performance metrics. Appsmith empowers you to build a tailored analytics reporting software with its drag-and-drop interface, pre-built widgets, and seamless integration with various data sources. Say goodbye to the limitations of off-the-shelf solutions and create a reporting tool that caters to your unique business needs.
Why build an Analytics reporting software instead of buying one?
Why build an Analytics reporting software instead of buying one?
Building a custom analytics reporting software with Appsmith offers numerous advantages over purchasing a ready-made solution. Custom-built tools can be tailored to your specific business requirements, ensuring a perfect fit for your data analysis needs. Moreover, you have complete control over the features and functionality, allowing for greater flexibility and adaptability as your business evolves. Appsmith's user-friendly platform makes it easy for both technical and non-technical users to create powerful analytics tools without the high costs and limitations associated with off-the-shelf products.
What are the challenges of building an Analytics reporting software?
What are the challenges of building an Analytics reporting software?
Building an analytics reporting software can be challenging due to the need for seamless data integration, user-friendly interfaces, and customizable features. However, Appsmith simplifies this process by providing a drag-and-drop interface, pre-built widgets, and easy integration with various data sources. This enables both technical and non-technical users to create powerful analytics tools without the need for extensive coding or development expertise. With Appsmith, you can overcome the challenges of building an analytics reporting software and focus on deriving valuable insights from your data.
Which teams use Analytics reporting software the most?
Which teams use Analytics reporting software the most?
Analytics reporting software is widely used across various teams and industries, including marketing, sales, finance, operations, and product development. These tools help teams track performance metrics, identify trends, and make data-driven decisions to optimize their strategies. Appsmith's customizable platform allows you to build analytics reporting software tailored to the unique needs of each team, ensuring that they have access to the insights and tools necessary for success.
Why Appsmith for Analytics reporting software?
Customizable Dashboards and Reports
Appsmith enables you to create custom dashboards and reports that cater to your specific analytics needs. With its drag-and-drop interface and pre-built widgets, you can easily design and configure your analytics tool without any coding.
Seamless Data Integration
Connect your analytics reporting software to various data sources like PostgreSQL, MongoDB, REST APIs, and more. Appsmith's pre-built connectors make it easy to fetch, analyze, and visualize data from multiple sources in one unified platform.
Collaborative Development Environment
Appsmith's collaborative development environment allows teams to work together on building and refining their analytics reporting software. Share your progress, get feedback, and iterate quickly to create the perfect tool for your business needs.
Do magic with widgets
Chart Widget for Data Visualization
The Chart widget enables you to visualize your data in various formats like bar, line, pie, and more. Customize the appearance and interactivity of your charts to create insightful and engaging analytics reports.
DatePicker Widget for Time-based Filtering
Use the DatePicker widget to add time-based filtering to your analytics reporting software. This allows users to easily select date ranges and view data for specific time periods, enabling more focused analysis.
Dropdown Widget for Data Segmentation
The Dropdown widget lets you add data segmentation options to your analytics tool, allowing users to filter and analyze data based on specific criteria. Customize the dropdown options to suit your unique business requirements and enhance your data analysis capabilities.
Get live support from our team or ask and answer questions in our open-source community.
Watch video tutorials, live app-building demos, How Do I Do X, and get tips and tricks for your builds.
Discord
Videos
Do more with Appsmith
Ship a dashboard today.
We’re open-source, and you can self-host Appsmith or use our cloud version—both free.