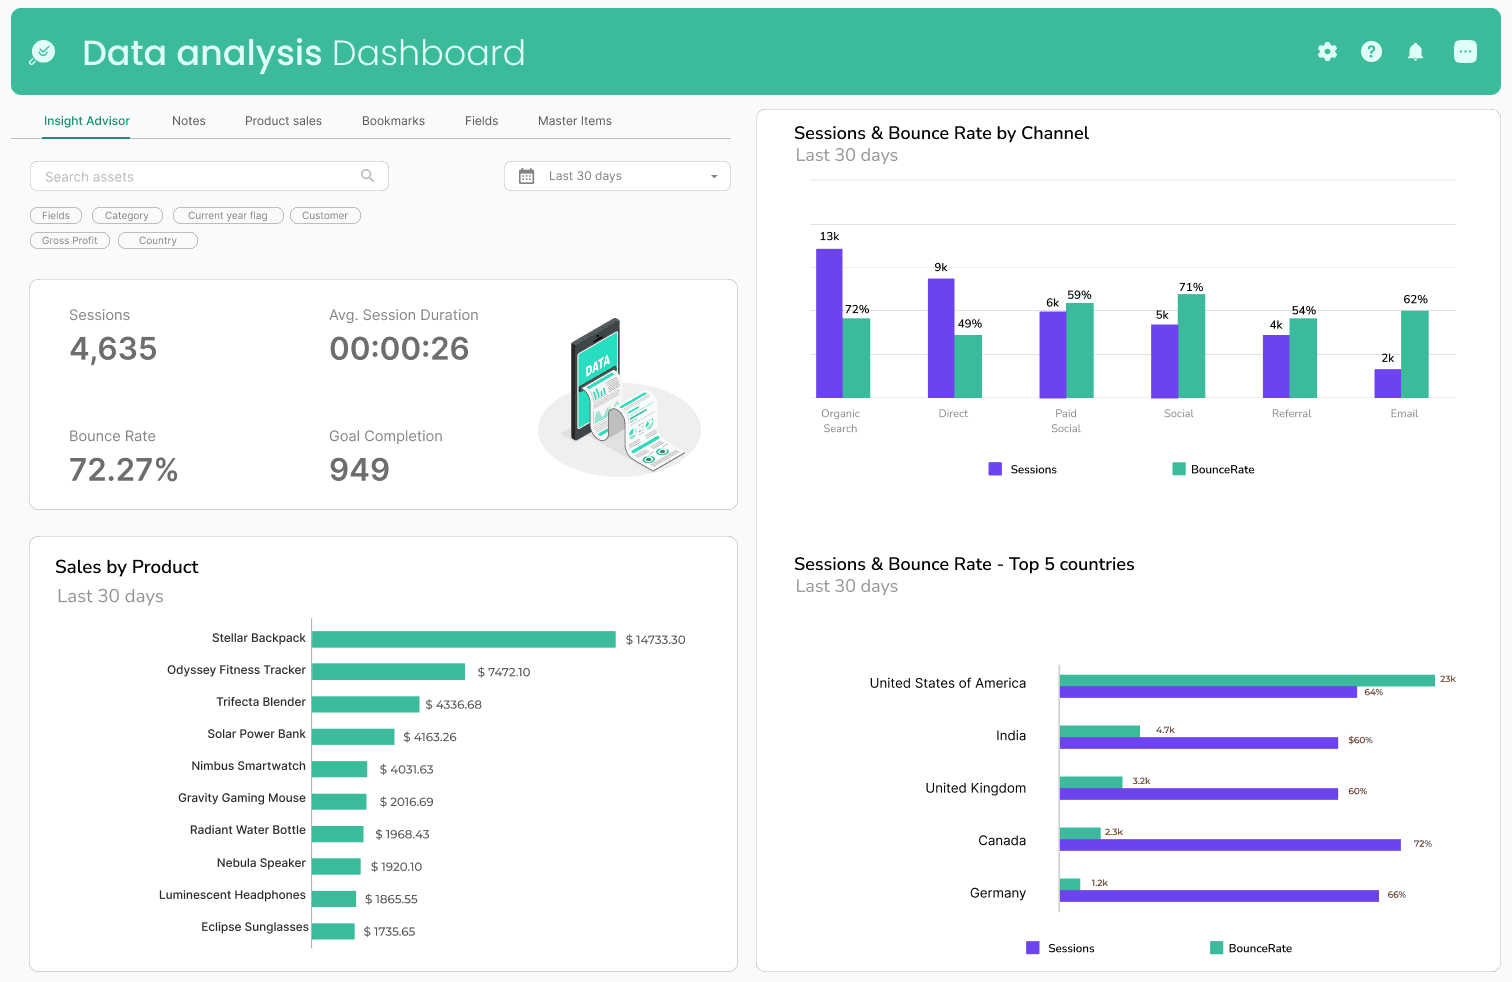
Visualize Data with Powerful Dashboards
Transform complex data into insightful visualizations using Appsmith's customizable data visualization dashboards, driving informed business decisions.
FAQs
What are the common features of a data visualization dashboard?
What are the common features of a data visualization dashboard?
A data visualization dashboard typically includes features like interactive charts, graphs, tables, and maps to represent data in an easily digestible format. Appsmith enables users to build these features effortlessly with its drag-and-drop interface and pre-built widgets. Users can customize their dashboards to display real-time data, filter and sort information, and integrate with various data sources, ensuring a comprehensive and up-to-date view of their data.
Why build a data visualization dashboard instead of buying one?
Why build a data visualization dashboard instead of buying one?
Building a custom data visualization dashboard with Appsmith offers numerous advantages over purchasing an off-the-shelf solution. Custom dashboards can be tailored to your specific requirements, ensuring a perfect fit for your business needs. Additionally, Appsmith's platform allows for seamless integration with your existing data sources and APIs, providing a unified view of your data. Building your own dashboard also offers greater control over data security and privacy, as well as the flexibility to scale and adapt as your business evolves.
What are the challenges of building a data visualization dashboard?
What are the challenges of building a data visualization dashboard?
Building a data visualization dashboard can be challenging due to the need for technical expertise, data integration, and customization. Appsmith addresses these challenges by providing a user-friendly platform that simplifies the dashboard creation process. With its drag-and-drop interface, pre-built widgets, and seamless integration capabilities, Appsmith empowers users to build powerful, customized dashboards without the need for extensive coding or development experience.
Which teams use data visualization dashboard the most?
Which teams use data visualization dashboard the most?
Data visualization dashboards are widely used across various teams and industries, including marketing, sales, finance, operations, and IT. These dashboards help teams track key performance indicators (KPIs), monitor trends, and identify patterns in data, enabling them to make data-driven decisions and optimize their strategies. Appsmith's versatile platform caters to the diverse needs of different teams, allowing them to build customized dashboards that provide valuable insights and drive business growth.
Why Appsmith for data visualization dashboard?
Rapid Dashboard Development
Appsmith enables software engineers to quickly build and deploy data visualization dashboards with its intuitive drag-and-drop interface, pre-built widgets, and extensive library of data connectors. This accelerates the development process and reduces the time to market.
Seamless Data Integration
Appsmith supports seamless integration with various data sources, including databases, APIs, and third-party services. This allows users to easily connect their dashboards to multiple data sources, providing a unified and comprehensive view of their data.
Customizable and Scalable
Appsmith's platform is highly customizable and scalable, allowing users to tailor their dashboards to their specific needs and requirements. As your business grows and evolves, Appsmith enables you to easily adapt and expand your dashboards to accommodate new data sources, metrics, and visualizations.
Do magic with widgets
Chart Widget for Data Visualization
The Chart widget allows you to create interactive and visually appealing charts, including line, bar, pie, and doughnut charts. Customize chart properties to effectively represent your data and gain valuable insights.
Table Widget for Data Organization
The Table widget enables you to display and manage data in a structured format, with features like sorting, filtering, and pagination. Customize table columns and styles to present your data in a clear and organized manner.
Map Widget for Geospatial Analysis
Visualize geospatial data with the Map widget, which supports various map styles and marker customization. Analyze location-based data and identify trends and patterns to make informed decisions.

Get live support from our team or ask and answer questions in our open-source community.
Watch video tutorials, live app-building demos, How Do I Do X, and get tips and tricks for your builds.
Discord
Videos
Do more with Appsmith
Ship a dashboard today.
We’re open-source, and you can self-host Appsmith or use our cloud version—both free.