Debugging your app in Appsmith with the Appsmith Debugger, Part 1


“”Featuring the Error pane with a never-before-seen breakdown of what it is and how it can help you debug your apps lighting fast
That’s a tongue twister, innit? Almost.
Here’s a meme that isn’t. It’s just the painful truth.
There is no perfect code, so you know debugging is inevitable, but it’s still a chore and is as crushing often times as the meme claims it is.
But, while debugging is inevitable, making it painful is optional, especially when you have the Appsmith Debugger. We have claimed we champion developer experience as many times as we could before without being brazen about it. We think. So, we thought some more and said, “Let’s prove the claim, too.”
“Wait, wait. What is the Appsmith Debugger?”
In 2021, we shipped the Appsmith Debugger, a set of Chrome DevelTools-like features that have helped you investigate and resolve errors in Appsmith.
We recorded a video for it in a series about the Debugger, talked about it in our docs, and referenced it enough times to make you groan about our obsession with errors. If this is the first you are hearing of it, get on our e-mail list so we can tell you some more about it.
Why we did this
Browser dev tools are as helpful as a magnet when looking for iron fillings in a pristine haystack. To the untrained eye, they can be downright criminal, too.
Sure, sure, they nest groups of errors and there are separate tabs for the Console and the Debugger, but meh! There’s a sea of error messages, system logs, console logs, and then there’s you swimming in it.
Before we shipped the debugger, you saw,
errors inside a widget's Property pane that floated on your canvas which probably already had several widgets
the Editor’s Response pane, which clubbed legit responses with errors
The Debugger solved several of those problems.
What’s the Debugger have
Available on app.appsmith.com and our self-hosted release images, it can be called by toggling the debug icon—the one that looks like a bug—on the bottom-right corner of your Appsmith screen or with CTRL/CMD +D.
Inside the Debugger, live three panes, Errors, Logs, and Inspect Entity, each with their own uses. In the first part of this two part post, we will break the Error pane down for you and see how it can save you hours over browser dev tools in debugging.
“”If you would much rather just learn about Logs and Inspect Entity, bookmark this post. We will link to Part 2 in five days. :-)
Errors
Borrowing from a browser’s dev tools sub-window but improving on it radically, the Error pane lists all errors that we see when you are building inside Appsmith. Familiar examples include syntax errors from JavaScript bindings, reference errors from queries, and datatype mismatch errors.
Errors in the pane are specific to an Appsmith entity. Translated from Appsmithlish, it means you see helpful error messages about a faulting widget, a rogue query, or a stubborn JS Object.
These errors get logged to the pane in lockstep with the sequence of code execution in Appsmith.
The Error pane is the default view when working with widgets—most noticeable if you have the Debugger sub-window resized as in the pictures in purple—so you know what’s going wrong and where in real-time.
The Editor’s Error pane is smarter. It doesn’t automatically switch to the Error pane—Response is the default on this screen—when an error occurs. Instead, the
Debugicon lights up in red with a numeric notification that’s like a running ticker for the number of errors the Debugger sees with your queries or JS Objects. Click it to open the Error pane.Every error you see in the pane follows a template with a few helpful pieces of info to help you debug.
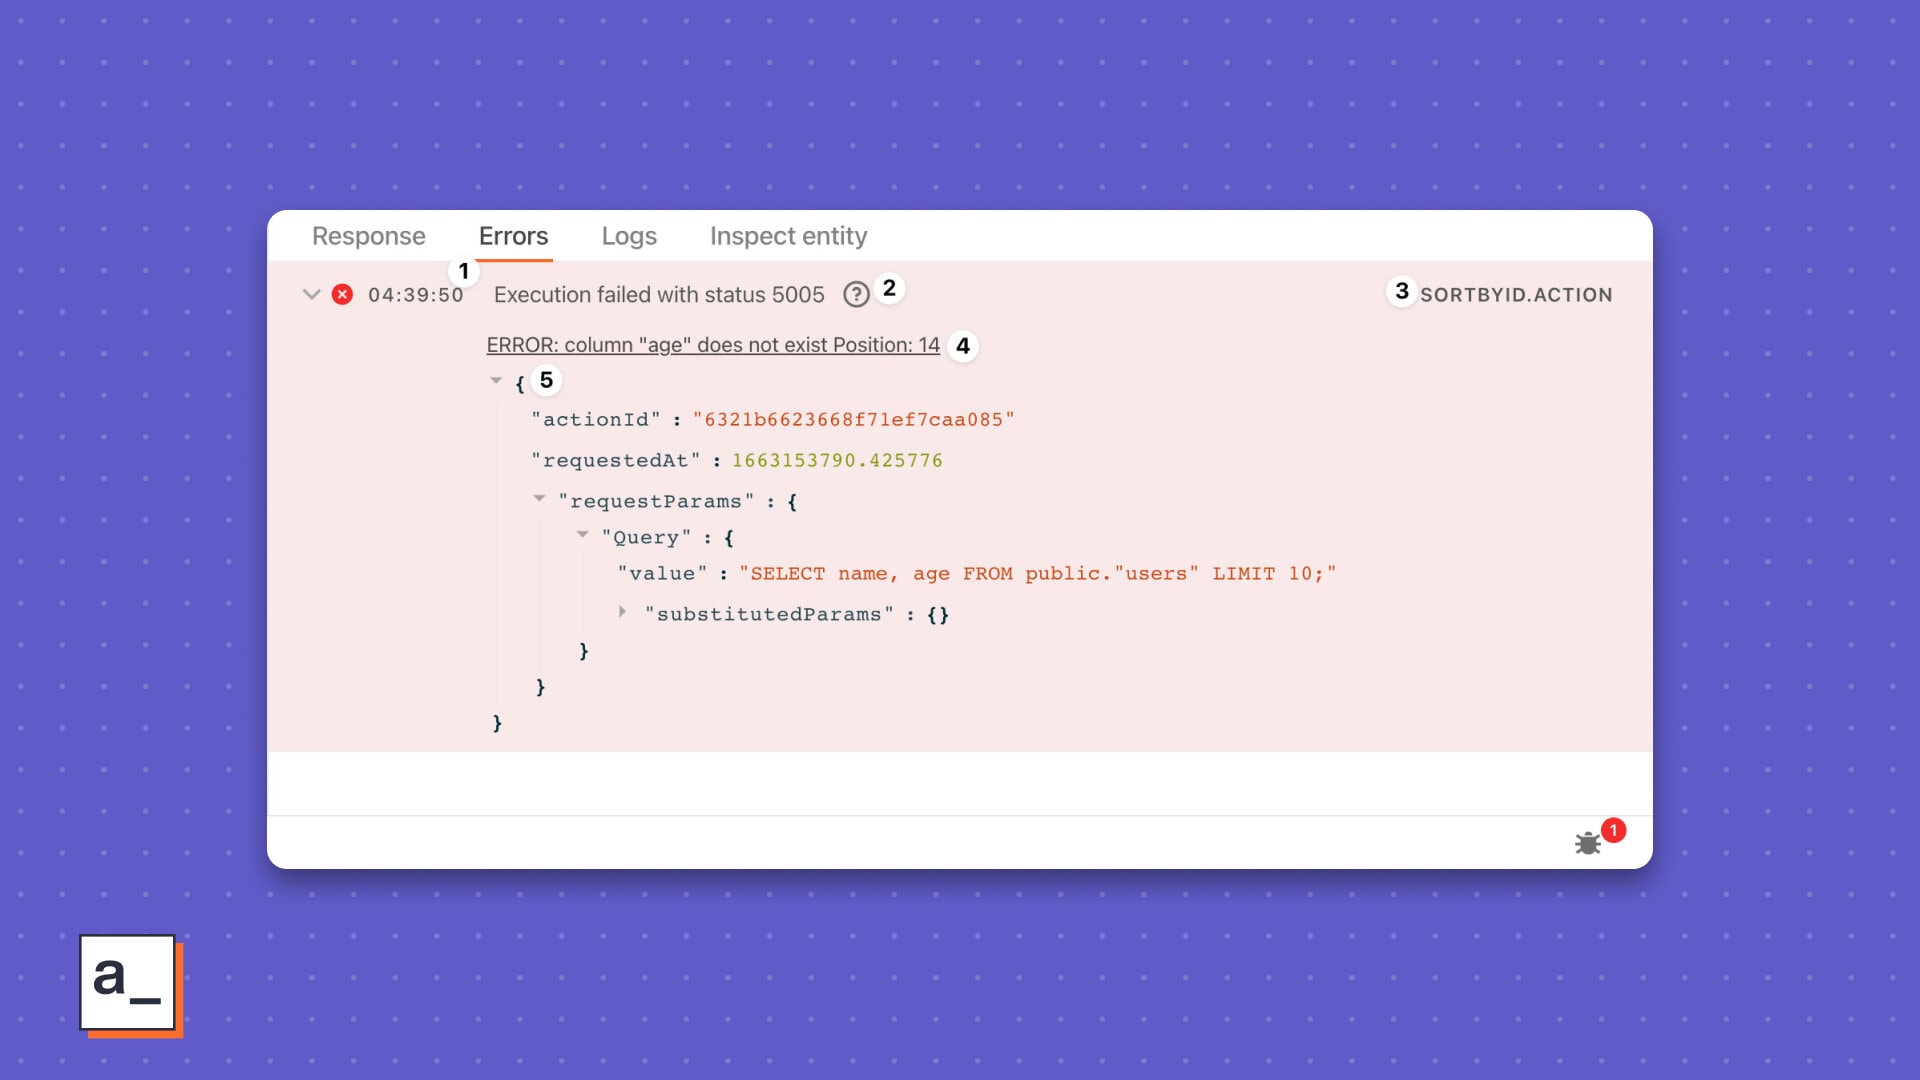
The timestamp
Logged as your code executes or a value evaluates with your widgets, these little breadcrumbs help you track back from when the error occurred to when last it was A-Okay.
The issue Depending on the error type, you will see a couple different kinds of issues.
With widgets, you’ll see the faulting widget property’s name. An example of this is the commonplace
The value at tableData is invalid, occurring when the propertytableDataexpects anArraydatatype but you have anArrayinstead.With queries, you see more specific errors, often specific to the datasource you are running your queries to, often indicated by status codes returned by your failing requests.
With JS Objects, we straight-up level with you about the parseability of your functions. Parseability probably isn’t a word, but you know what we mean.
The source
This has two parts to it—the entity’s name.the type of entity the troublesome one is, e.g., SELECT1.WIDGET. As is obvious and has been to you, SELECT1 is the entity’s name and WIDGET is the entity type.
👌🏾 Appsmith Experience plug Clicking the source takes you to the faulting entity anywhere in Appsmith, be it a widget, a query, or a JS Object. Noice!
The message
This is the most helpful part of the message, beginning with Error and ending with a helpful bit of text or a number.
Because widgets bind to queries or JS Objects using JavaScript, quite a few errors you see are the same as familiar JavaScript errors like
SyntaxErrororTypeError. Some other errors showis not defined. This is when a variable, a query, or a JS Object isn’t defined, but you have specified it in the Property pane.In the Editor, these messages go a step further and call out the line number in the editor that has the faulting code. For example,
Line 2: Unrecognized token '$'. This type of message has three parts to it.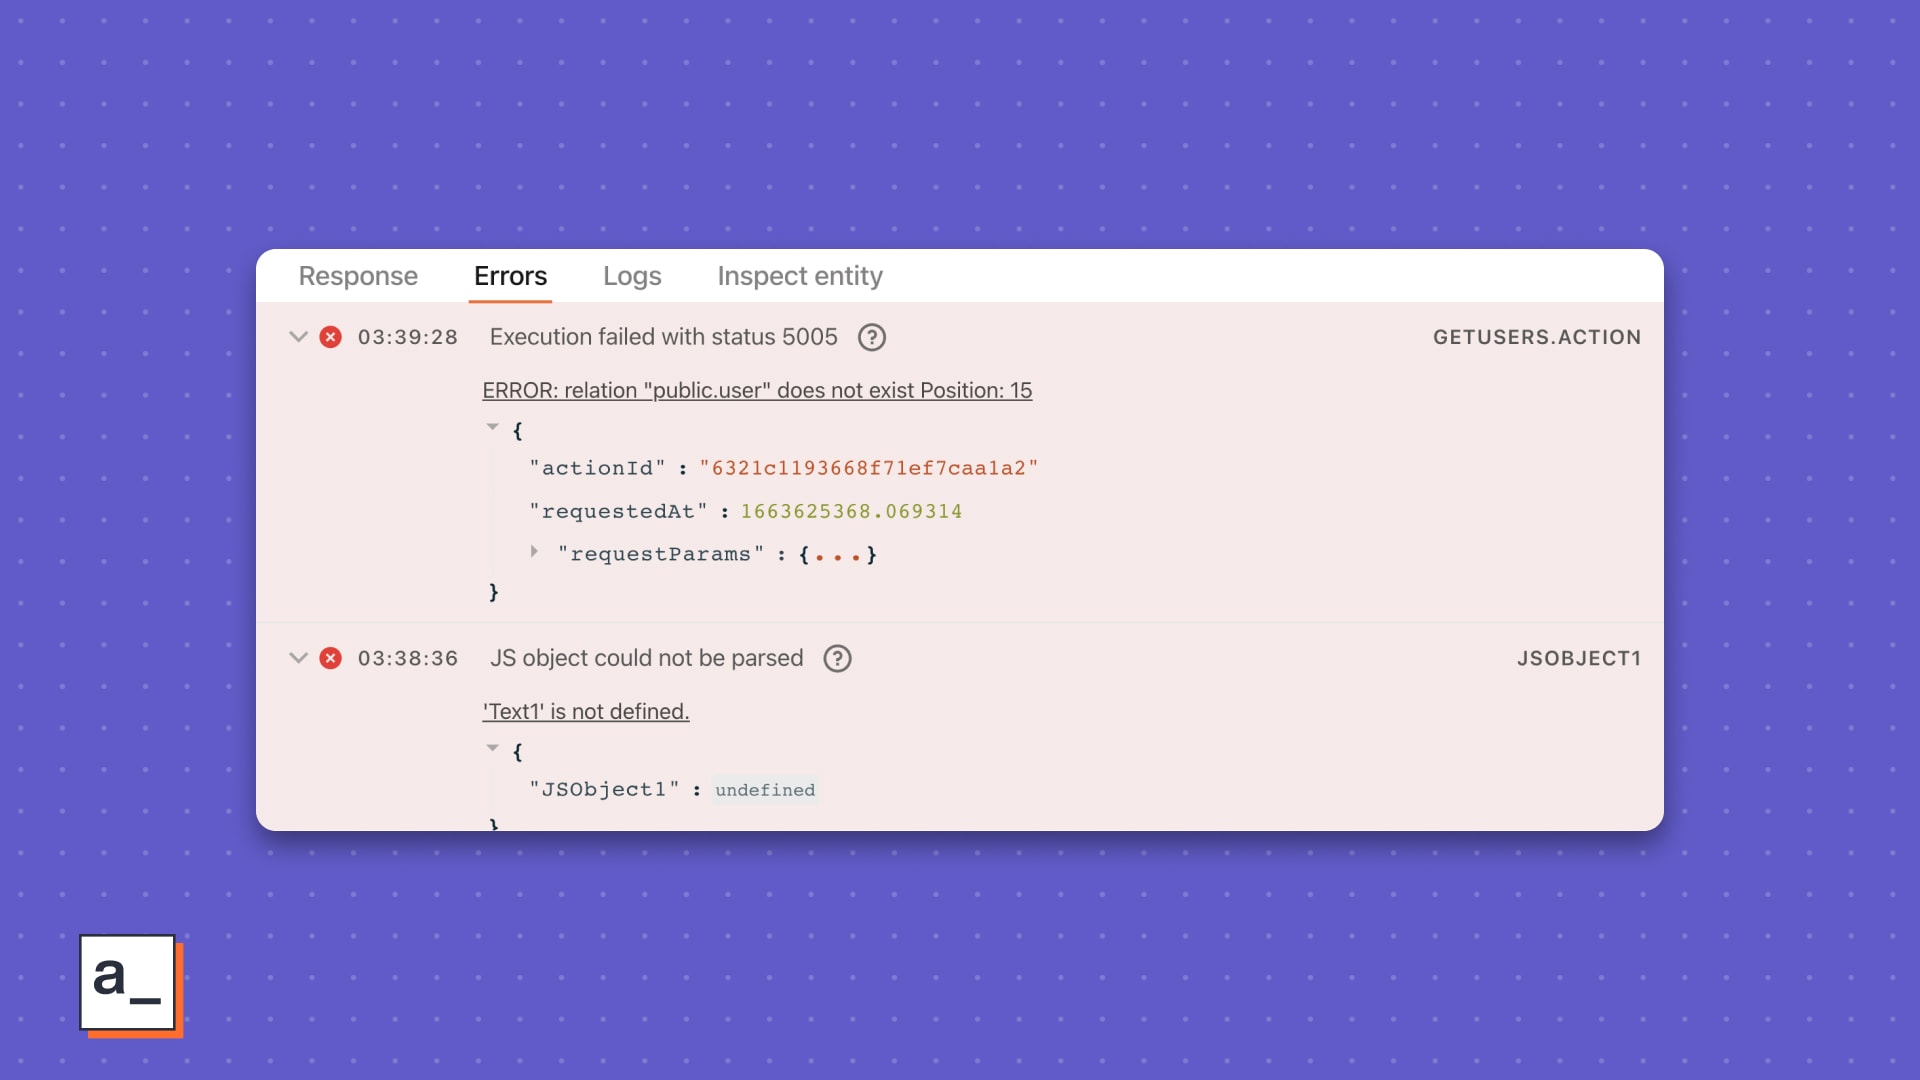
The type
ErrorThe string
relation “public.user” does not exitThe line number
Position 15
😻 Appsmith Experience plug Clicking the message will open our in-app docs finder and run a helpful search to show you top docs matching the error.
Response from queries or bindings This doesn’t always show, but when it does, it can show you helpful responses with query params or evaluated values of data bindings.
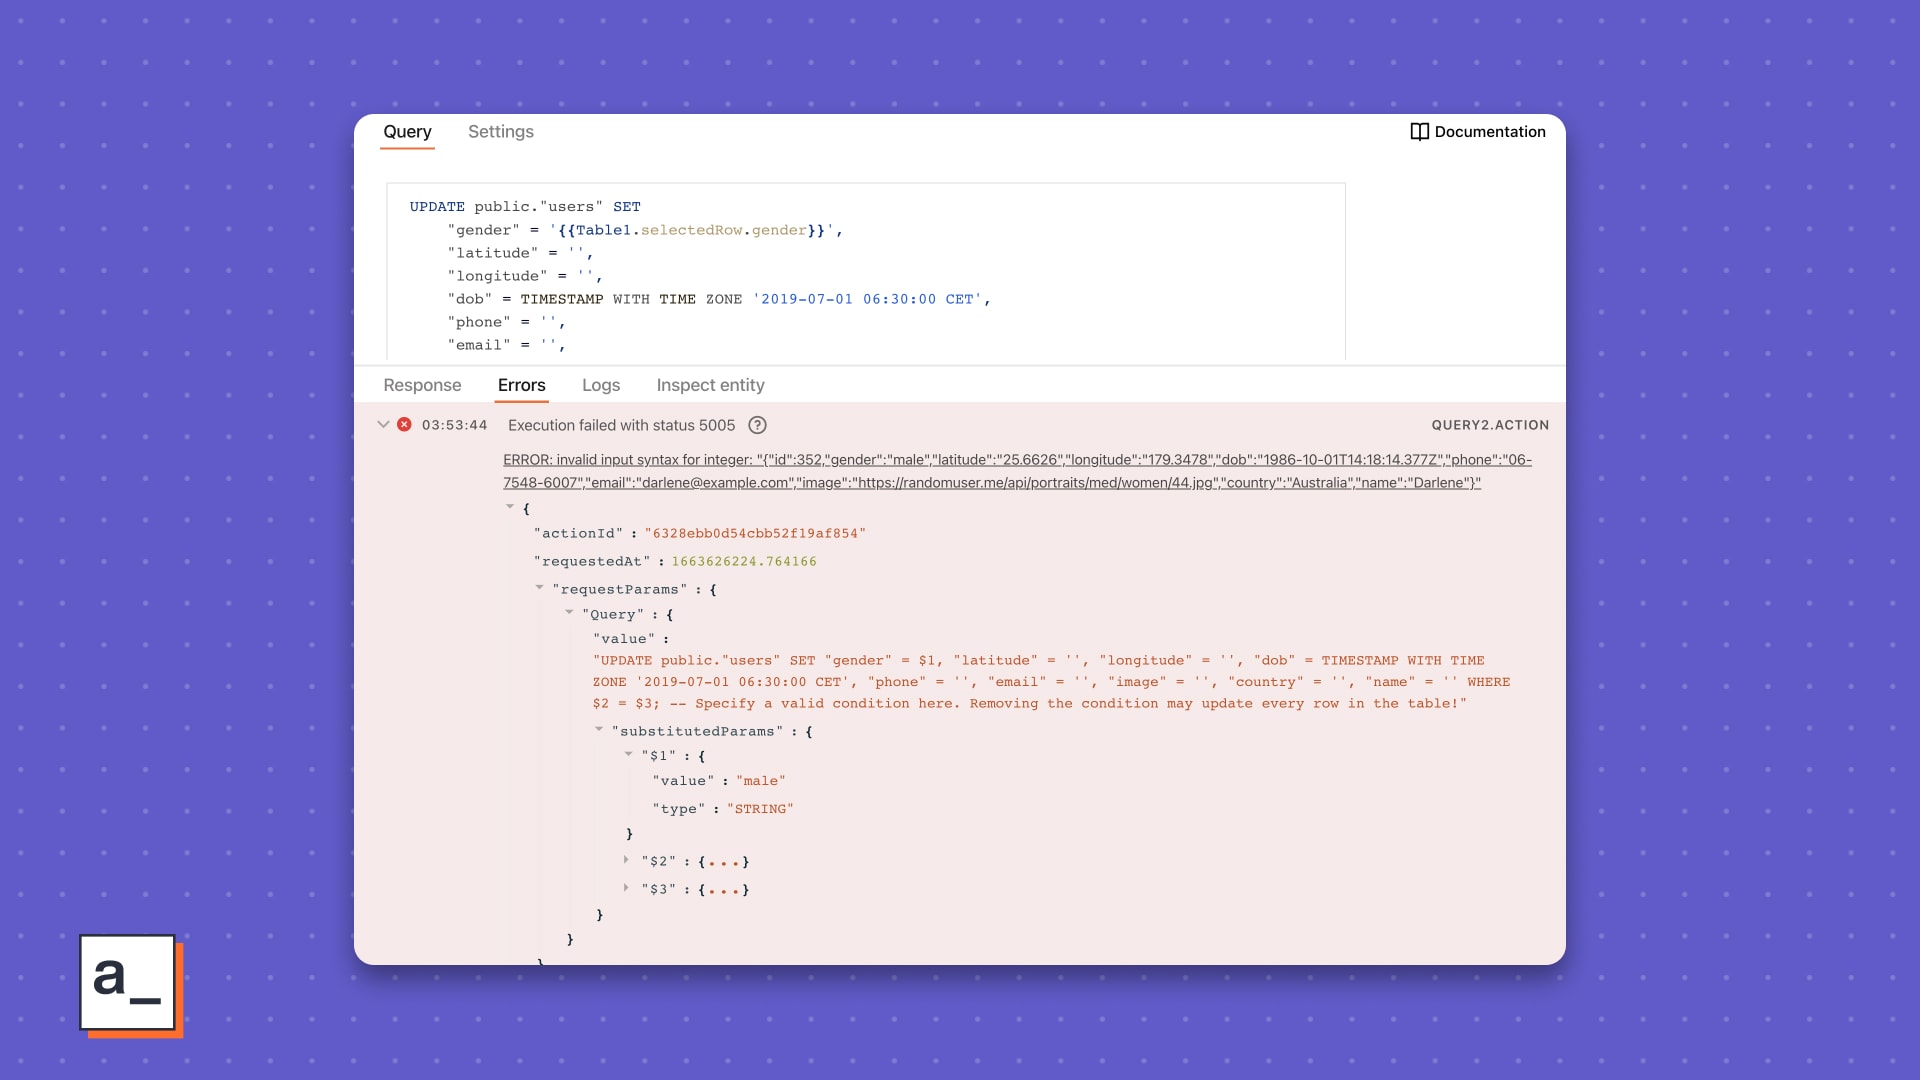
With widgets, you’ll see the evaluated value from the bindings.
With queries, you’ll see the payload from the API you are querying.
“How does all of this help?”
Consider two situations we have painfully drawn for you.
State #1 | Condition #1 | Scenario #1 |
|---|---|---|
You have several queries and widgets on your way to a complete build. | You have nested queries inside JS Objects. Meaning, these queries are binded to multiple widgets via JavaScript transformations and have dependent parameters with each other. | A query fails and returns an error. |
Without the Appsmith Debugger
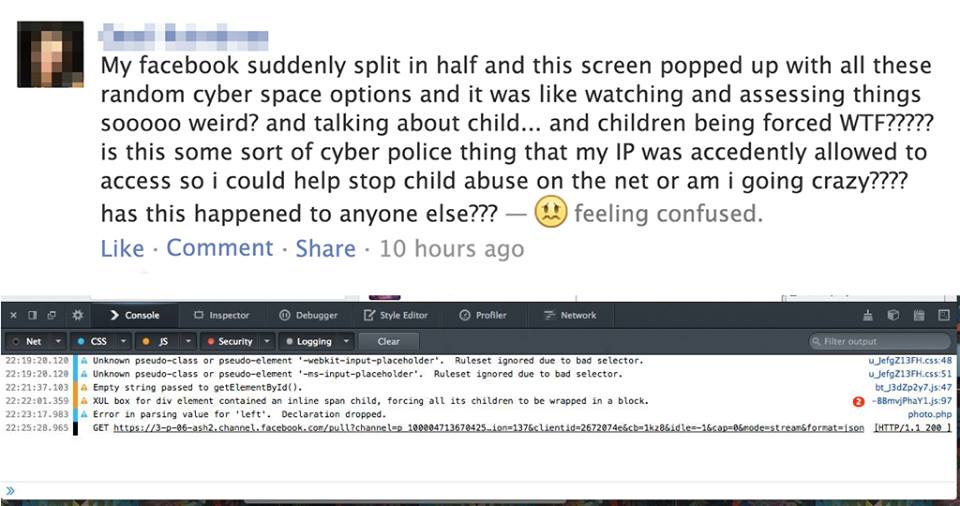
You decide to sift through the browser dev tools sub-window, trying to locate the faulty query in something that looks like ↓.
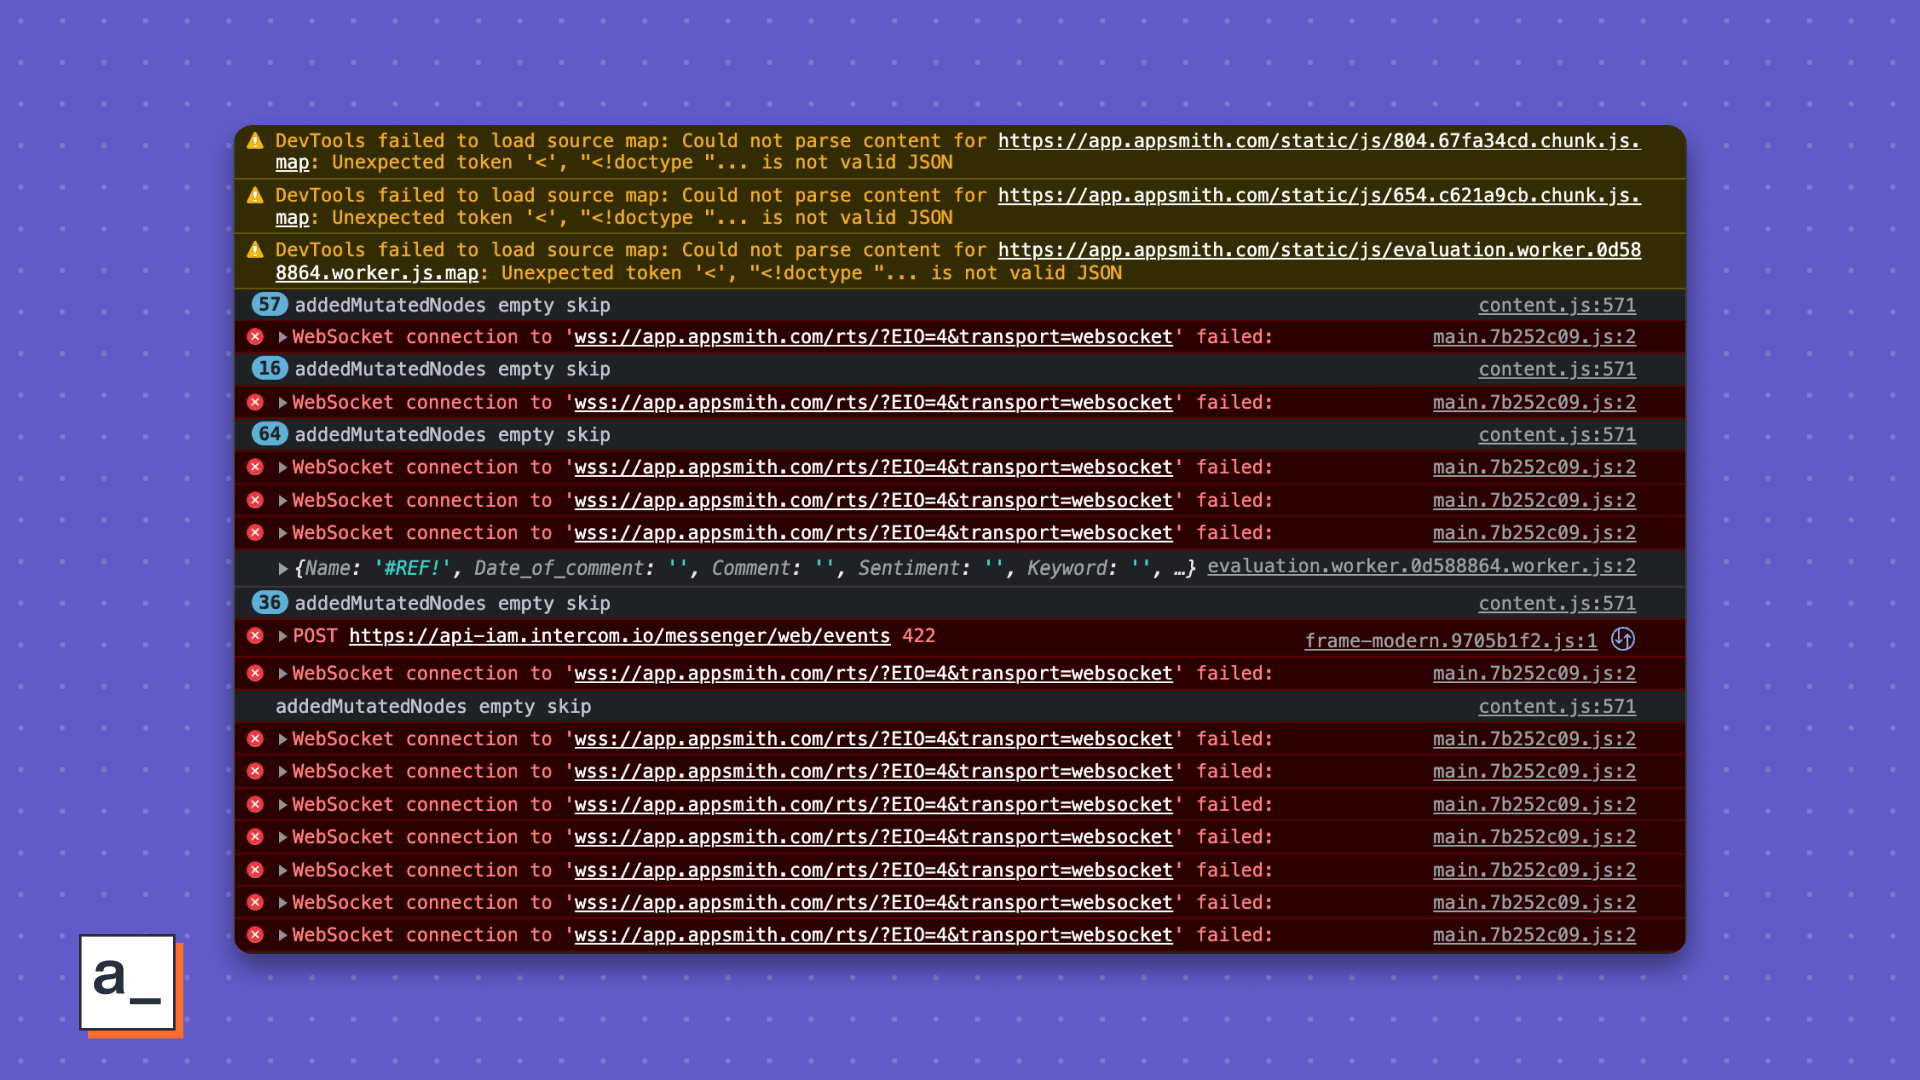
When you find the first problem query, you’re hoping against hope this is your patient zero.
If so, congratulations aren’t quite in order yet. You’re still going to have to surgery the query to see what went wrong where.
With browser tools, may you be lucky and find a fix in the first hour.
Most times, though, Murphy’s Law applies.
Meaning, you will need to find the last problem query.
Repeat steps #1 and #2 with all the sub-steps in between
If you have a friend who’s on Appsmith, you hear them say, “Good morning. Do you have a ready app? No? Try the Debugger. 🙄”
With the Appsmith Debugger
You see all the errors from all the failed queries In the Error pane and nothing else to crowd your investigation.
You quickly scan by the type of errors.
Errors are listed in the sequence of query execution.
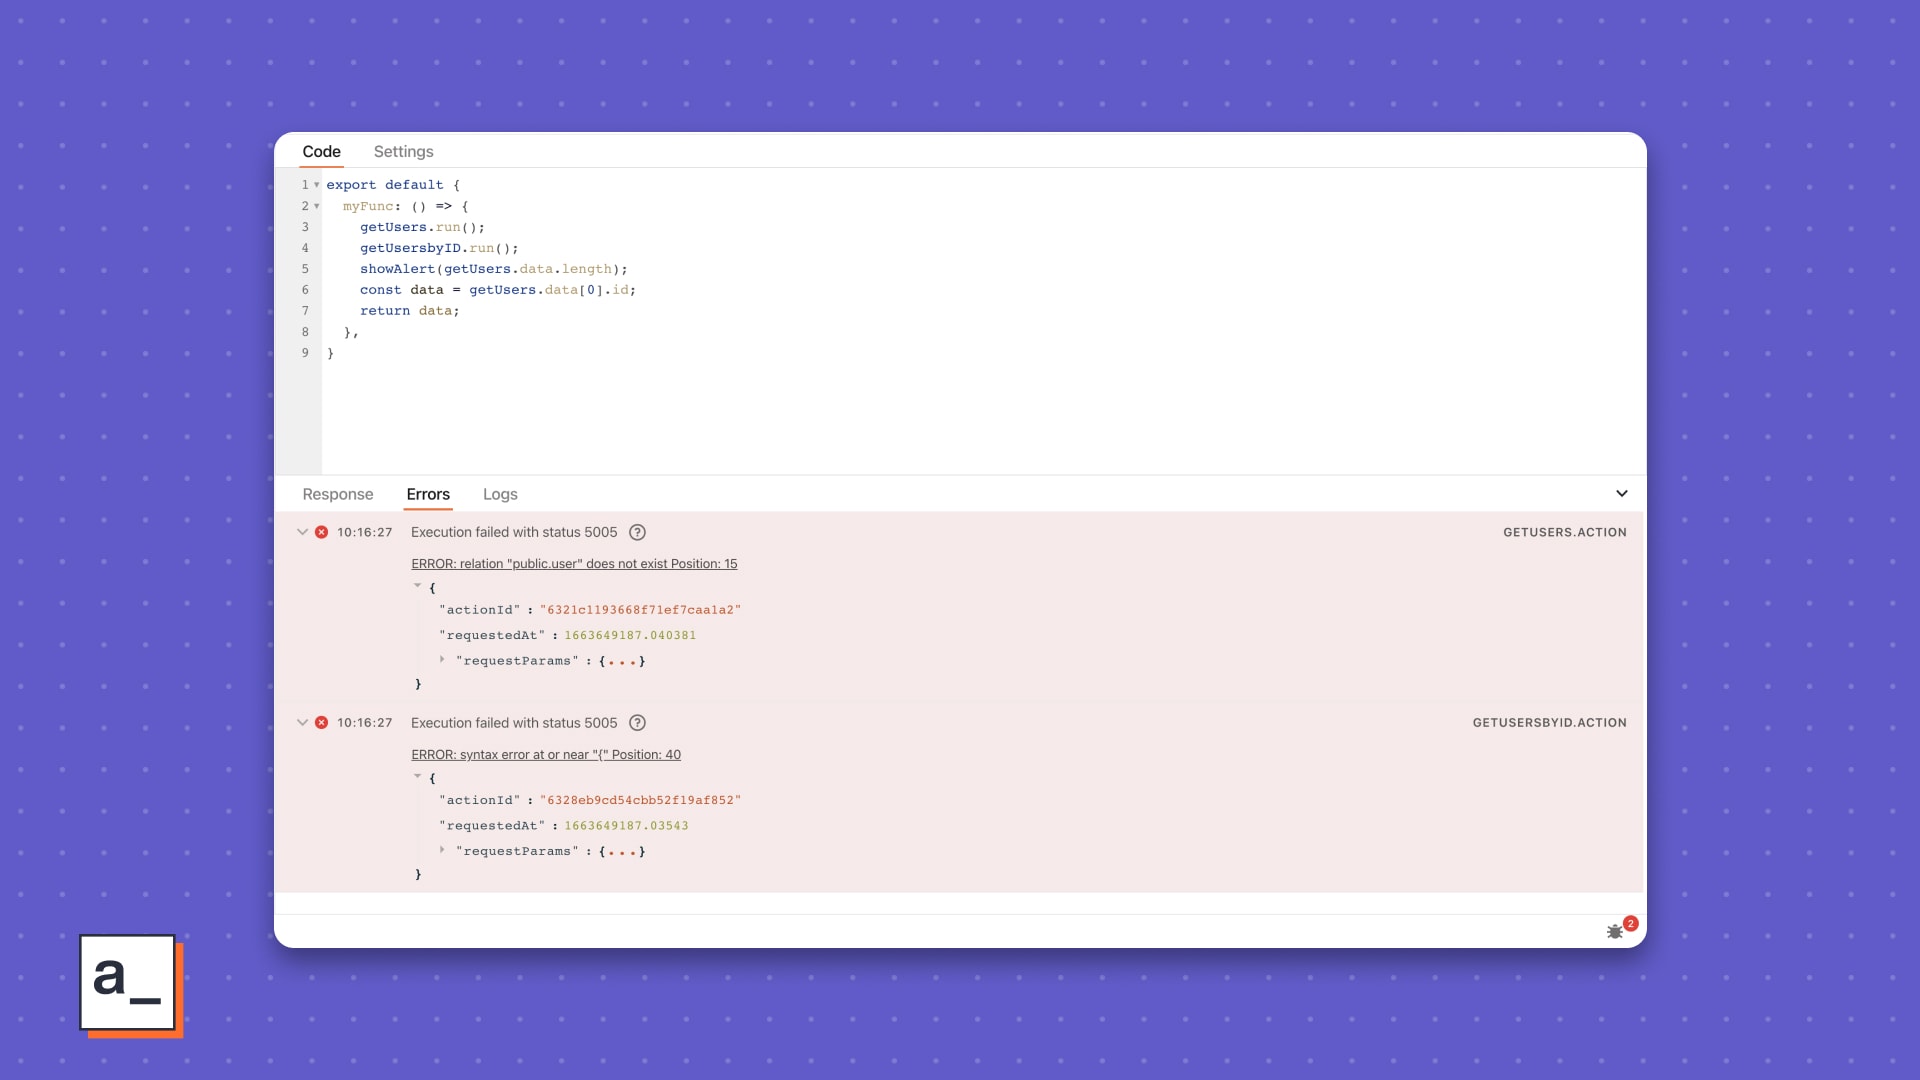
So you can simply scroll to the first failed query, and investigate further.
The error message tells you what failed with the params in which line, neatly indented neatly for you.
Don’t remember the query’s name? Pfft! We got it. Click the error message, and go right to the error source.
Trouble troubleshooting? Click the error message and find super-relevant docs in Appsmith’s doc finder.
At the end of it, you save a whole night’s hair-pulls, wake up bright and fresh, sip your coffee, and wonder why some people still use browser dev tools. 🤔 Maybe you should refer them to us.
State #2 | Condition #2 | Scenario #2 |
|---|---|---|
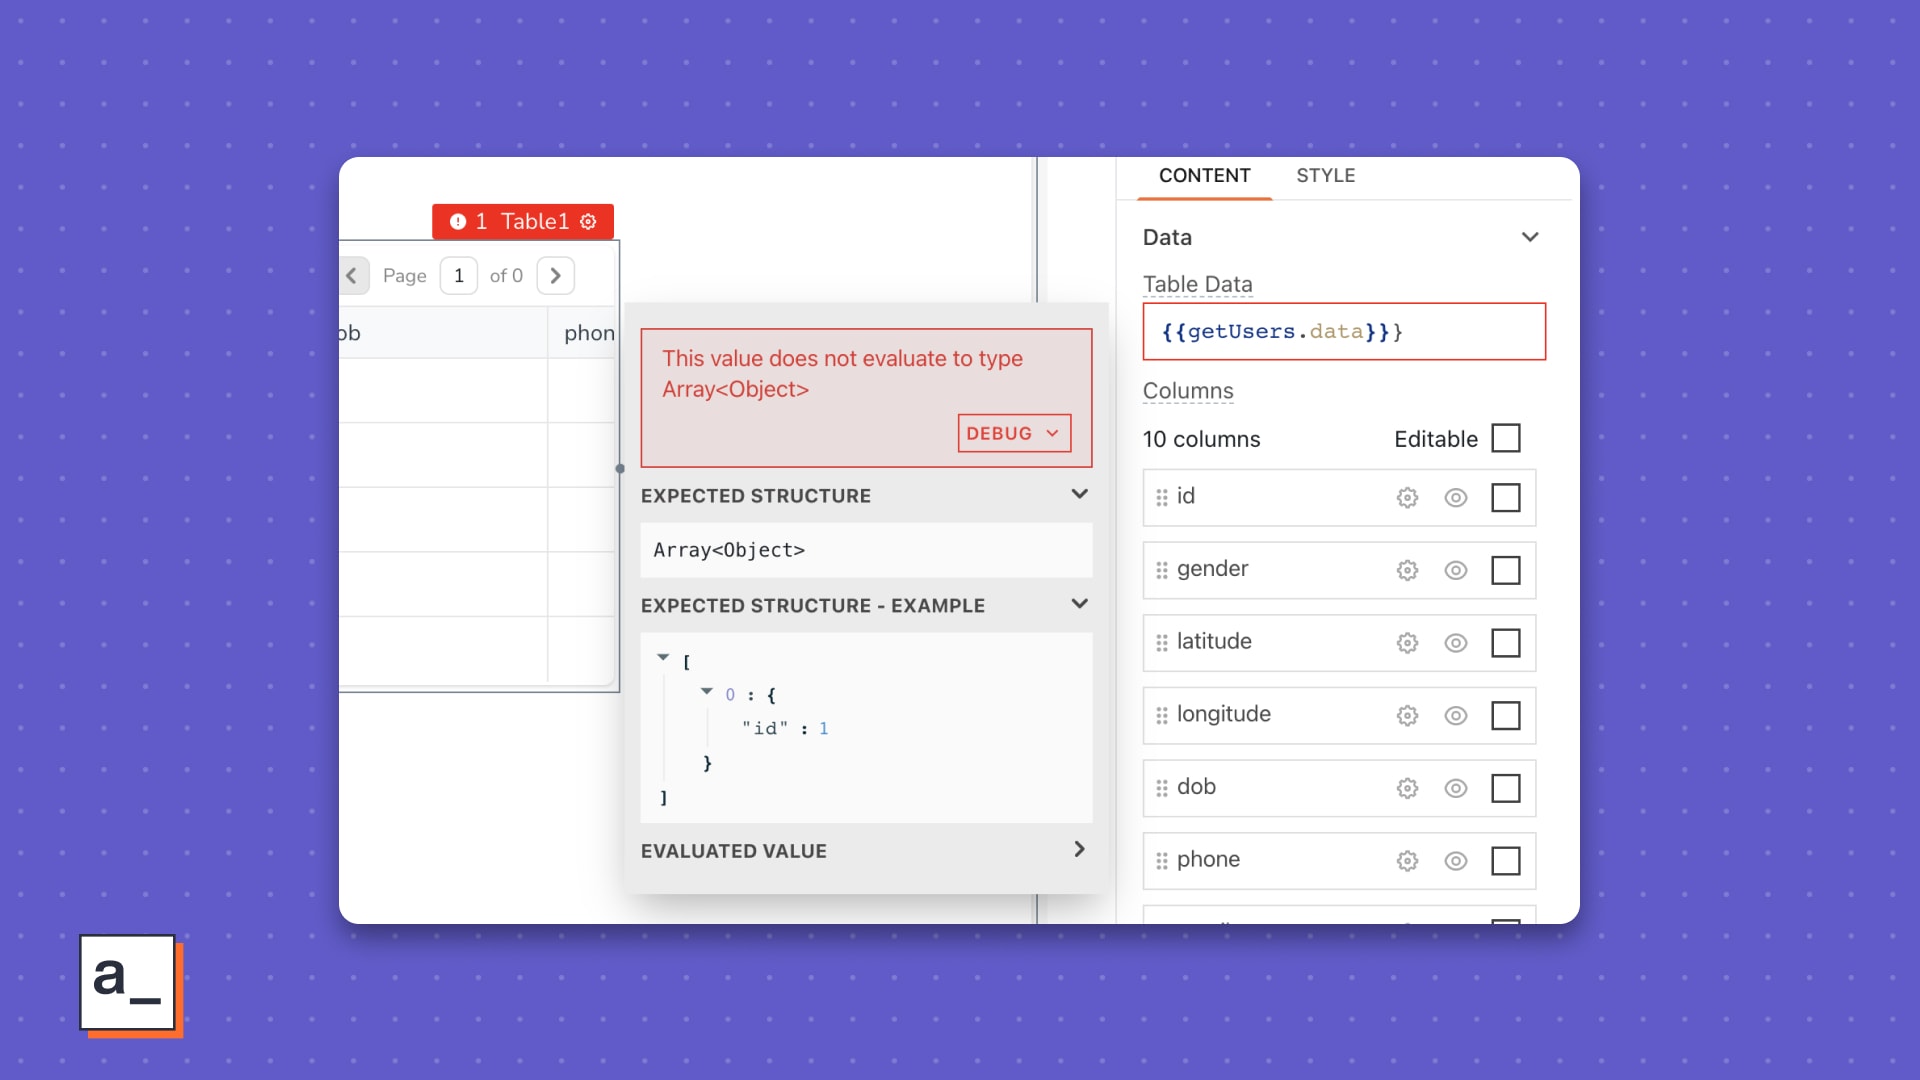
You have the data from a REST API and the table for your dashboard, but you have left the chart for the very end. You are sensible like that. Charts are tricky things in general. | You have to bind the chart widget from Fusion Charts or one of our defaults with a query that should output the format | You get a |
Without the Appsmith Debugger
You toggle around the floating
EXPECTED STRUCTURE,EXPECTED STRUCTURE - EXAMPLE, andEVALUATED VALUEpanes to understand the chart widget’s configuration.You have a JS Object for the transformation, so you now switch back and forth between the canvas and the JS Editor for each possible fix in the JS code.
By now, you have
console.loged your way to the browser tools sub-window. Magnet, meet Iron Fillings In A Haystack.Forgot the change you made to the JS Object five tries ago? Yeah, well, no System Logs, so what can you do, right? Maybe note each change on Sublime or VS Code from this point on.
With the Appsmith Debugger
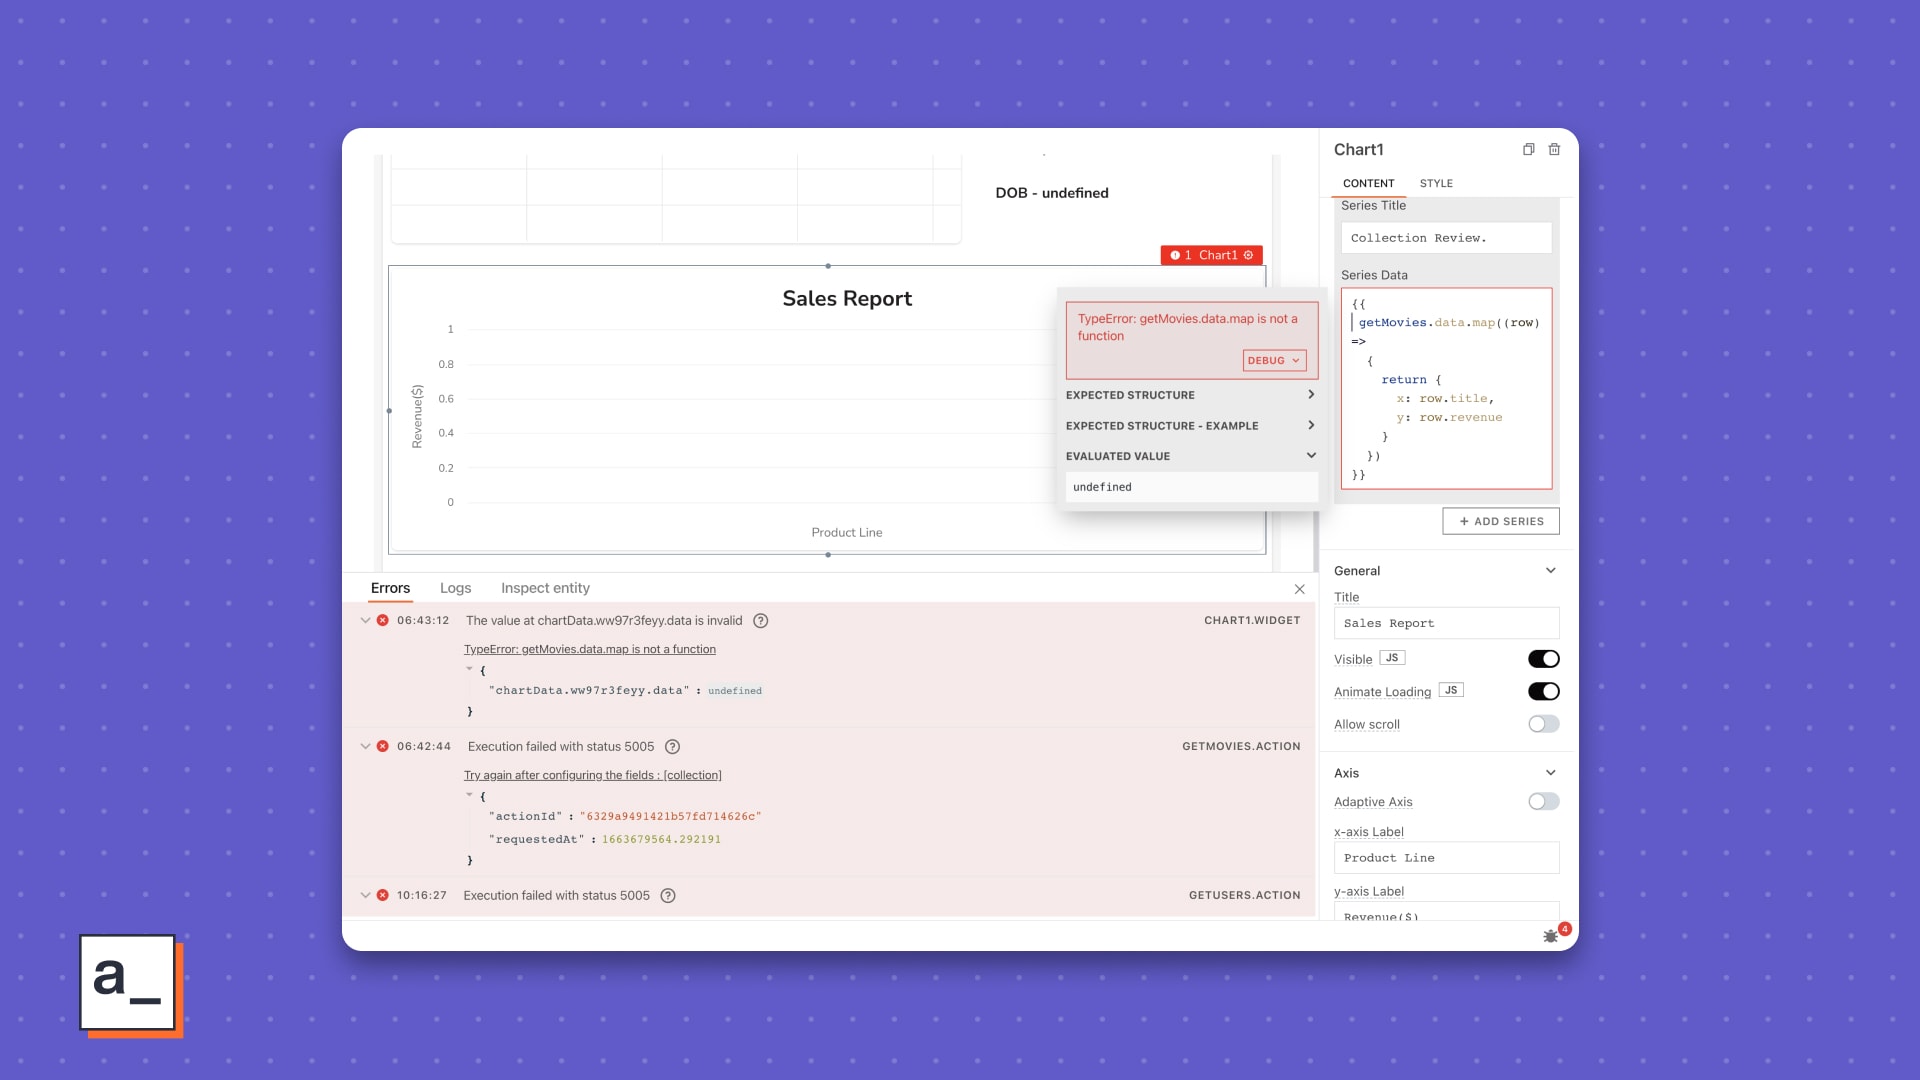
Right after you run the transformation, you see the floating-pane-that-we-don’t have-a-name-for-yet show you some red and the Error pane light up with all your errors, timestamped and sequenced by the order of code execution.
You see the type of error and the evaluated value for the faulting entity. Stick to this without worrying about the unnamed floating pane.
Your query has trouble getting a response from your datasource, so you see that error, but hey, you also see the binding failure of that same query with the widget.
No hunting for the query or the widget you want to troubleshoot. One click from the Debugger and you are transported to the associated entity.
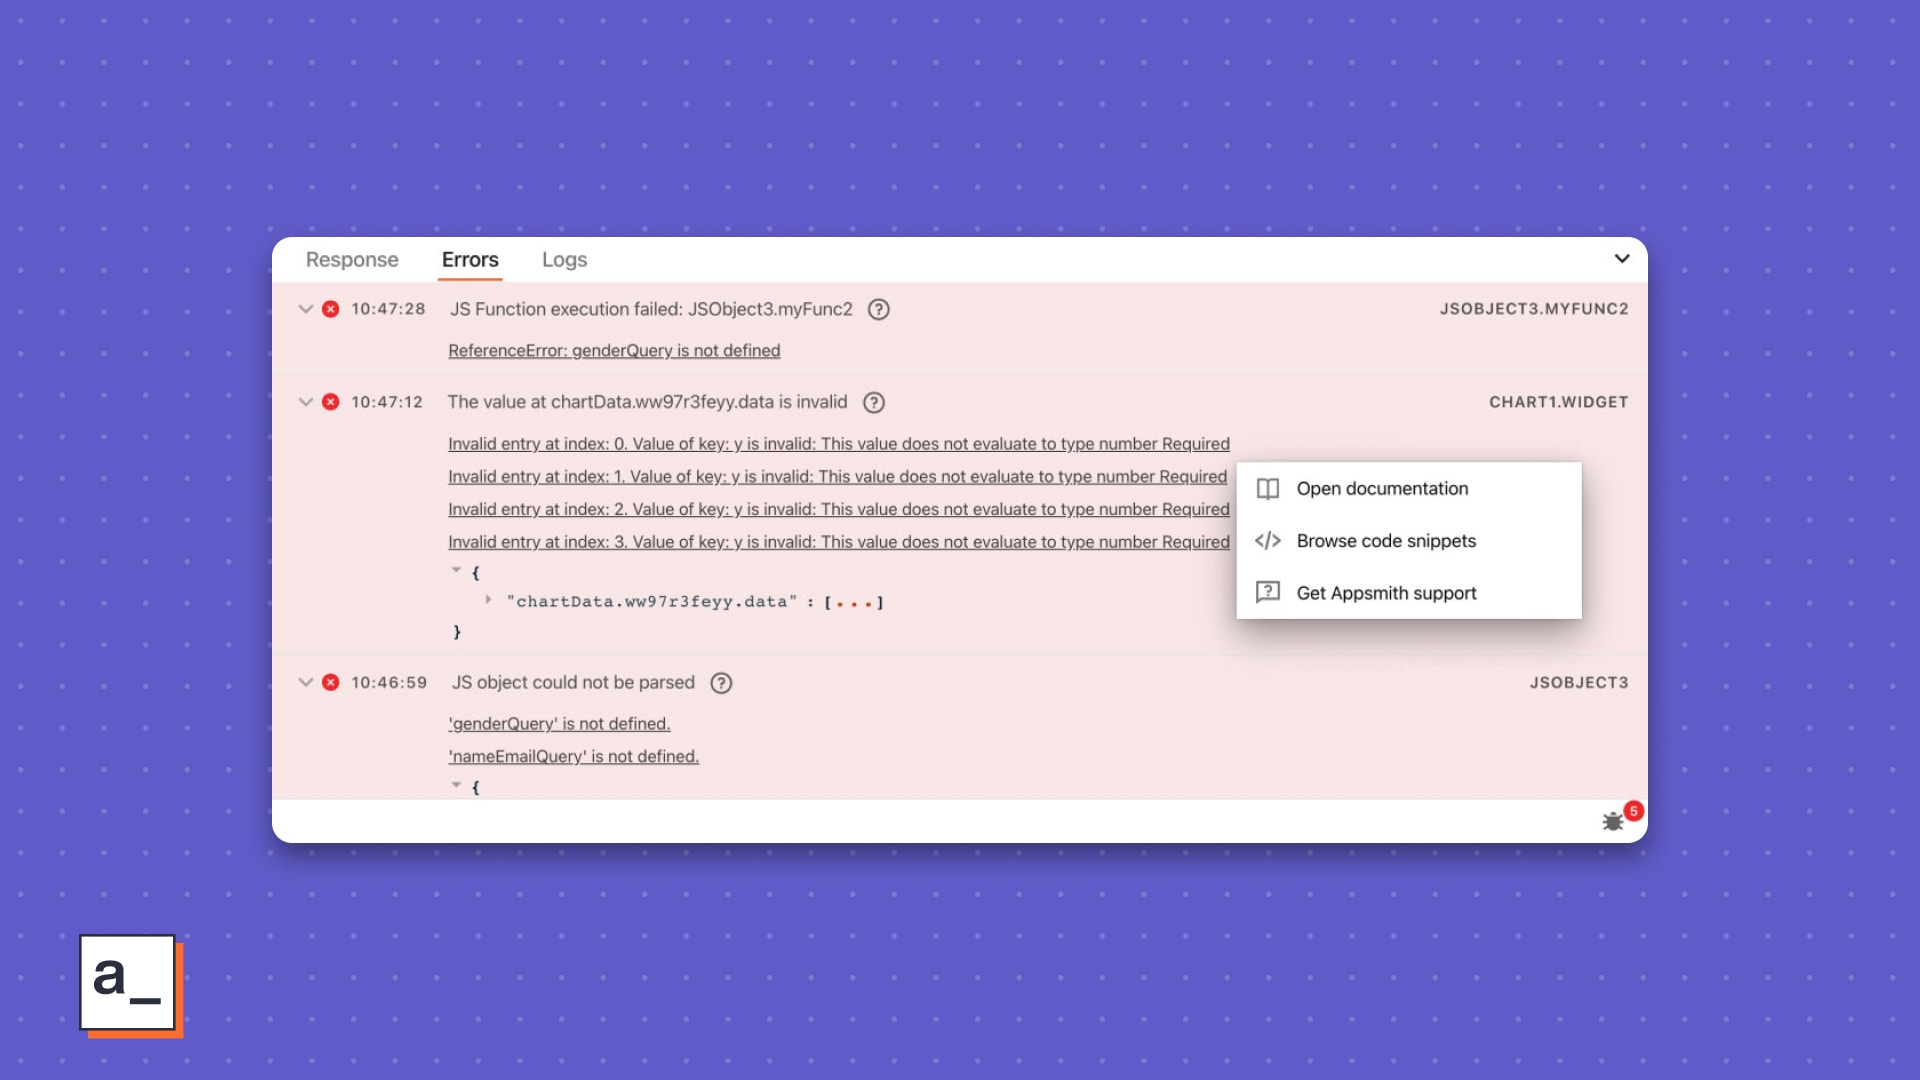
You see all the errors from the transformation in one pane with click-actions for each one of them.
Error messages not enough? Click the error and choose,
Browse code snippets, and voila! You now now search for the chart + the query right there and see some of our helpful docs.
Made it to here? Your life inside Appsmith is going to change.
Also, this is just part one of this two-part breakdown. What’s next?

Better than post-credits. A whole other movie featuring Logs and Inspect Entity.
Read, Debugging your app in Appsmith with the Appsmith Debugger, Part 2.
Meanwhile, here’s a few things you can do.
Tell us how you liked this post and what we can improve, even if it’s just the quality of our memes.
Raise an issue on our GitHub for a feature missing in the Debugger or anywhere else in Appsmith.
Follow and star us on GitHub so others like you can benefit from the most popular open-source app builder.
Until the next Debugger post, Appsmiths.
P.S.: We love you.
Related Blog Posts