Debugging your app in Appsmith with the Appsmith Debugger, Part 2

“”Let’s talk to the sidekicks, Logs and Inspect Entity
The first part of this teardown helped you see how the Error pane can save you hours in debugging and build better internal apps. In this one, let’s meet two seemingly innocuous features that can give you debugging super-powers when used right.
Logs
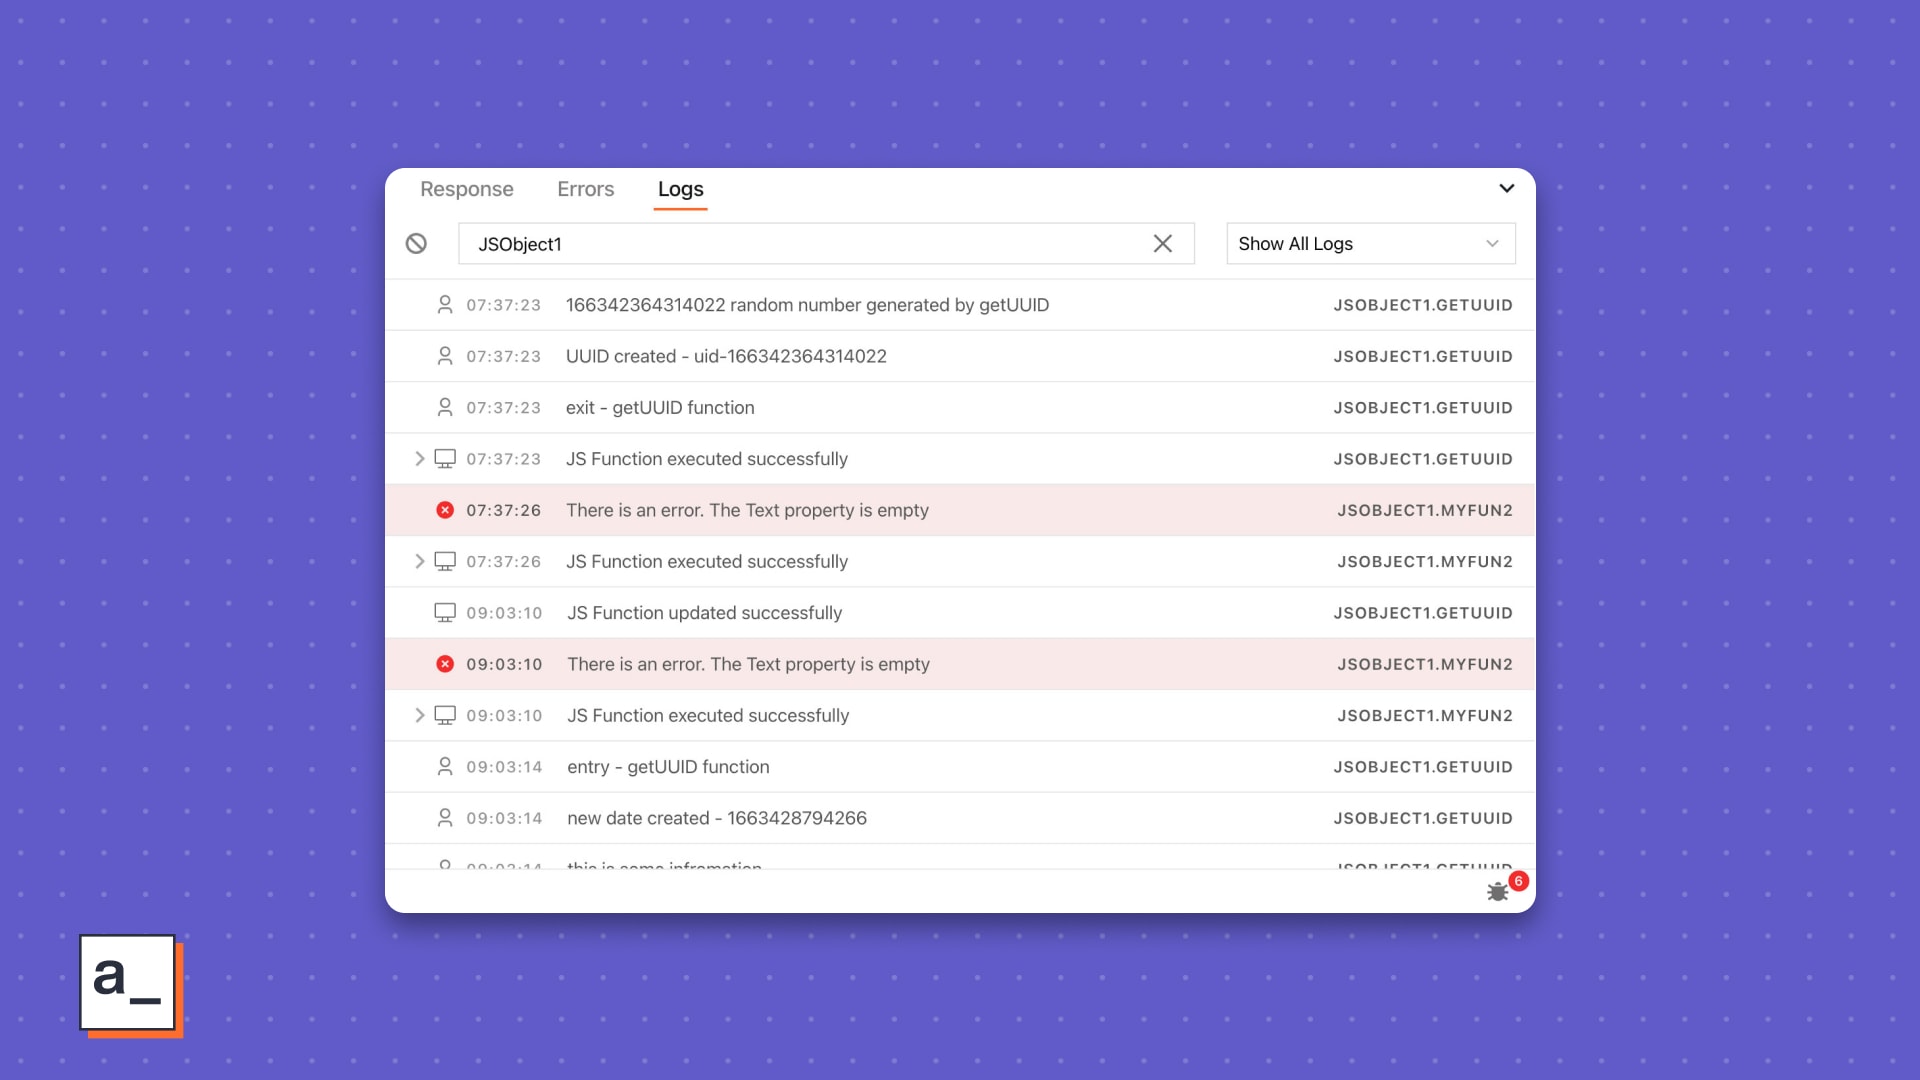
The Logs pane shows you everything logged by Appsmith and, like Errors, in lockstep with the sequence of code execution in your build. Borrowing from the experience of reading logs in general—in the browser console, from a shell, or on your favorite IDE—the Logs pane has four views for specific debugging use cases.
All logs
This view shows you all logs timestamped by when we saw them in your session in Appsmith. Updated a widget’s property, wrote a new action to your GraphQL datasource or ran a JS Object to concat two queries? It all gets logged—this, on top of the errors you see under the Errors pane brought here. You will see how that can be useful in a GIF, pun intended.
Just this view, though, can be a little overwhelming and a bit of work when you have been at your build for a while. To make it easier, use one of the three options under Logs.
Errors Logs
Everything you learned about the Errors pane applies to this view, too, but there’s more to errors here. Let’s see that in a real-world scenario.
State #1 | Condition #1 | Scenario #1 |
|---|---|---|
You have a button to reload a table, presumably to refresh the data from your datasource. | You use the Button property, | Your query fails. |
On just the Error pane
You see just the error for the failing query. Although helpful, it doesn’t offer context for the before and after of the error.
On the Error Logs pane under Logs
You see logs for the Button click and the
onClickevent executed.Because the
onClickevent is binded to queries and JS Objects, you see the actions that are successfully executed and those that fail.
While the Errors pane reports all the errors that happen, which has its own uses, the triaging in our example above is especially useful when you have nested queries, several dependent bindings, and a more complex workflow overall.
Console Logs
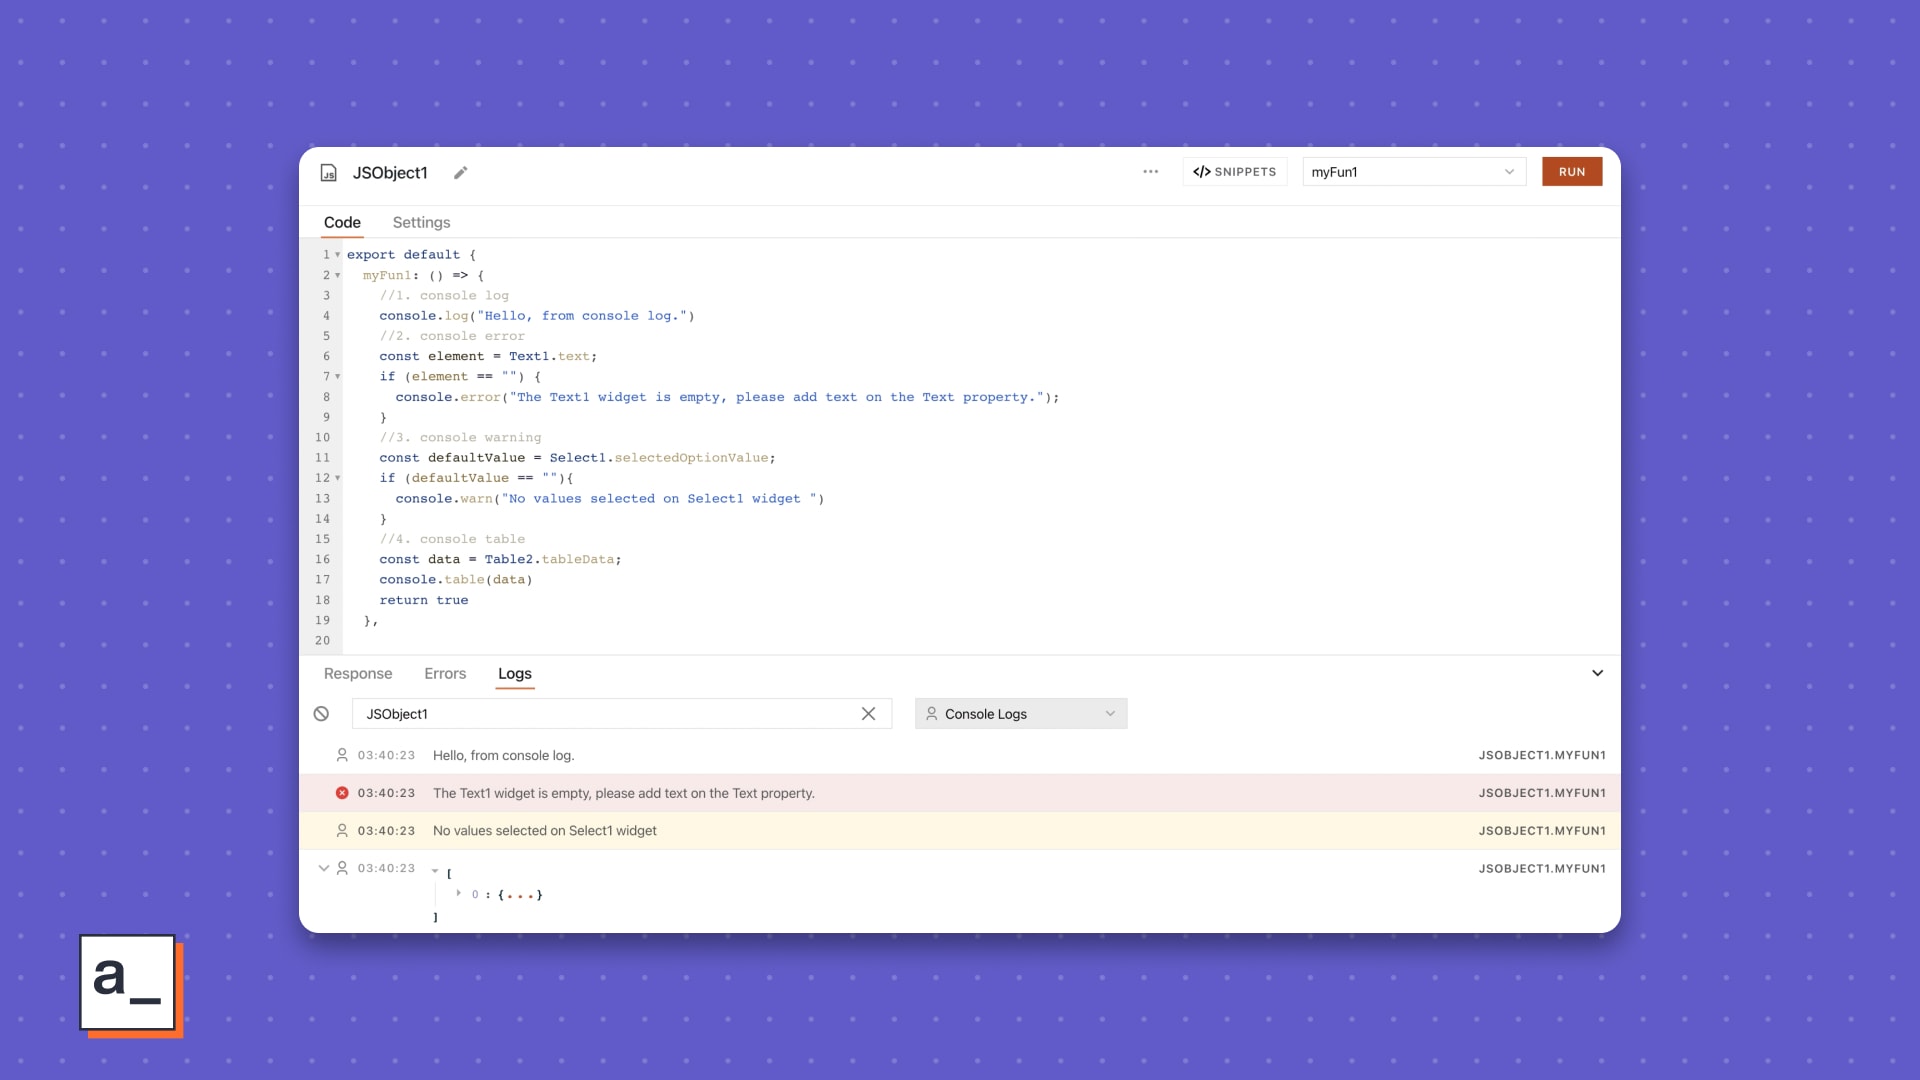
Just introduced in the Debugger, console methods in Appsmith help you see statements for just JS Objects and JavaScript bindings so much better than in the browser sub-window.
Set points in your code that you want to log statements at, view tabular data, or see groups for repeated errors.
System Logs
Automatically tracking all your interactions with Appsmith during build, System Logs show a helpful trail of activity by descending order of timestamp, especially useful when you want to go back in time or pivot from a point of failure to everything that led to it.
They show up for different situations and interactions for the type of entity you are working with.
With widgets, you see a log when you
Drag-and-drop a new widget on the canvas
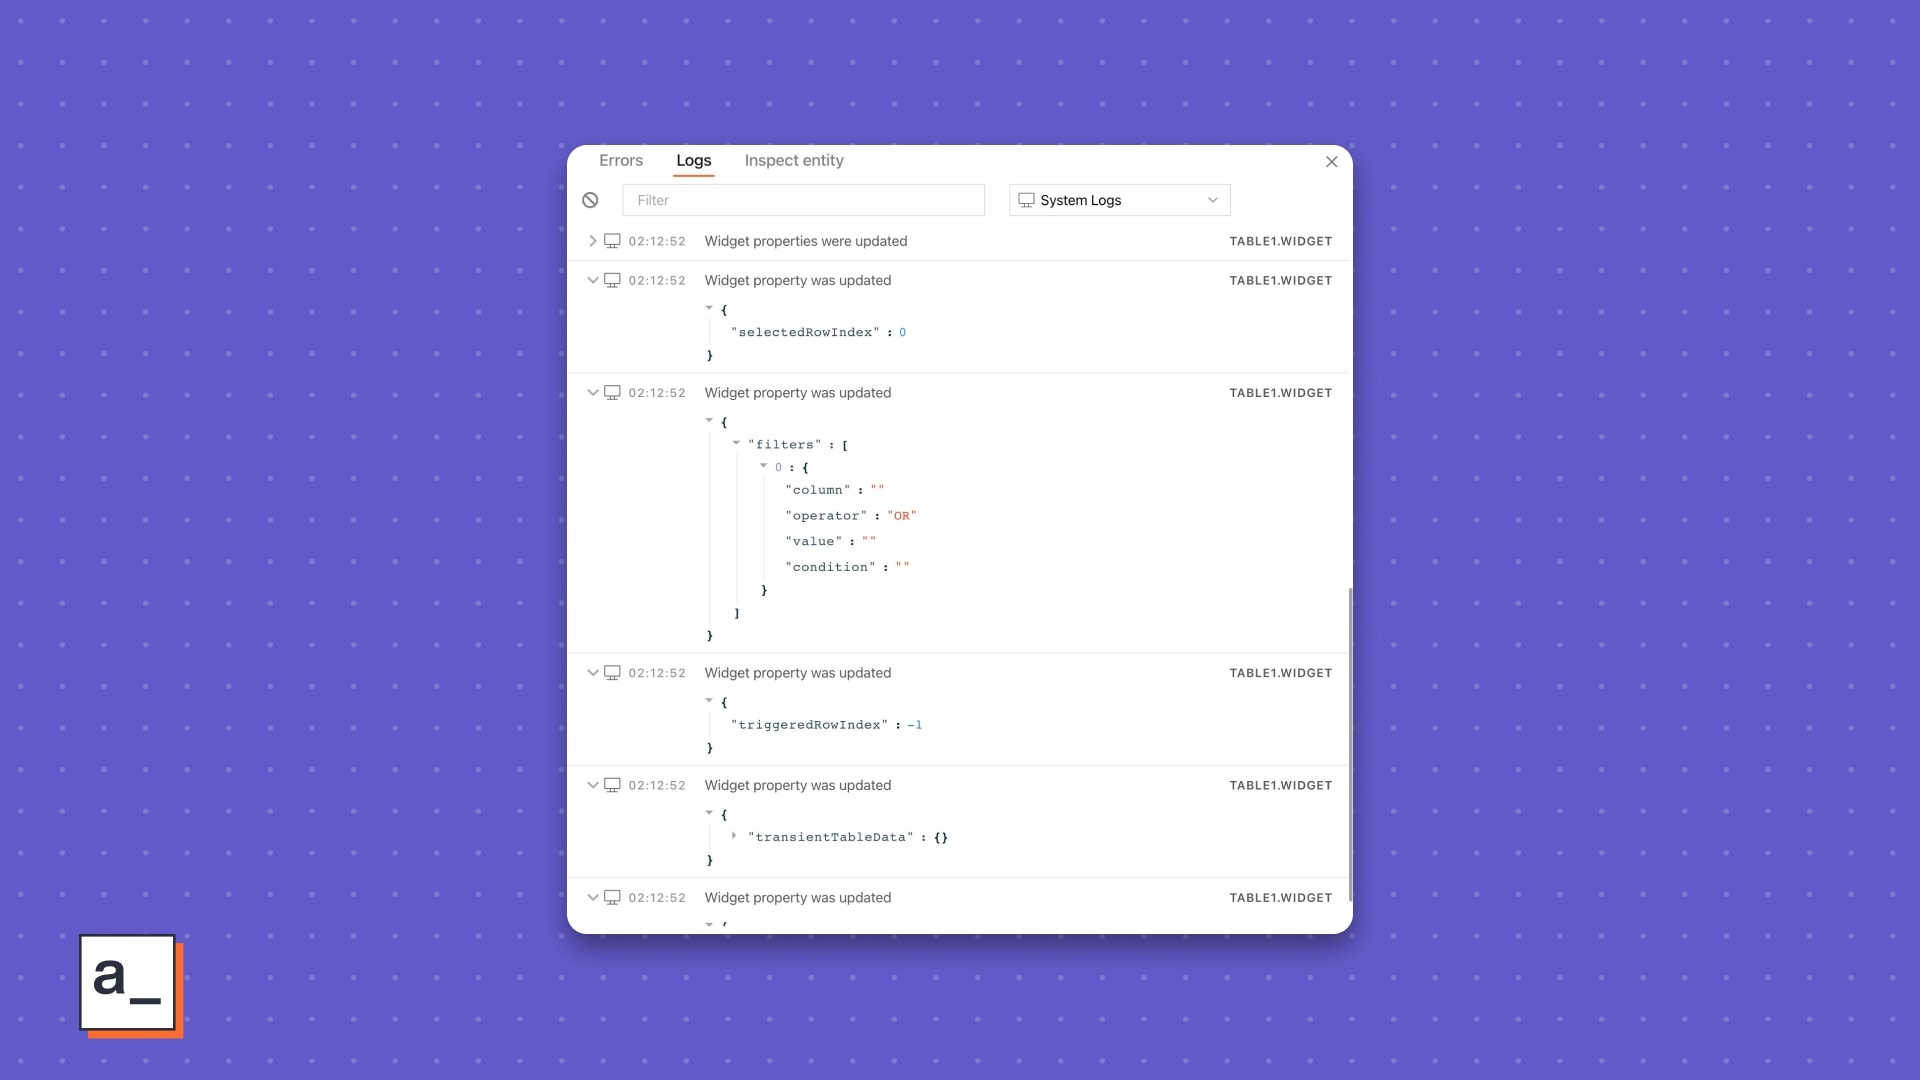
Update the widget’s properties Updating a property also updates all its dependent properties which then show up in system logs.
For example, when you update the
tableDataproperty, you also see its dependent properties likeselectedRowIndex,filters,triggeredRowIndex, and so on.Trigger events with an end-user action
For example, when you are using an end-user action to store a value with
storeValueor when you want a click-action to trigger an operation like an update or delete and are usingonClick, you see them show up in System Logs.Delete a widget from the canvas
With actions, you see them when you
Create a new datasource or a query
Update query properties like
queryName,queryBody,queryConfiguration, andqueryProperties.
For example, all your changes to a pagination query show up under System Logs.
Execute a query
This can be either from query pane, running a plain REST API query, a JS Object, or via a widget’s bindings
Delete a query
With JS Objects, you’ll see system logs when you
Create and update code inside JS Objects
Execute JS Objects
Just like errors, system logs are native to entities and have four parts to them.
The timestamp
Logged as your entities are created, updated and deleted, these little breadcrumbs help you track back from when the error occurred to when last it was A-Okay.
The message
Useful during build, the message of the log answers two questions— what were you doing with an entity—creating it, updating it, deleting it—and what happened with your action—success or failure.
With widgets, outside of CRUD information, you also see event-specific info like
onClickandshowAlertlinked to those widgets.Queries and JS Objects are straightforward with start and end points that indicate if they were updated, ran, and failed.
The source
Like errors, a system log has two parts to its souce—the entity’s name.the type of entity, e.g., SELECT1.TABLE1.WIDGET.
👌🏽 Appsmith Experience plug Clicking the source from the logs takes you to the associated entity anywhere in Appsmith, be it a widget, a query, or a JS Object. Noice!
The response
This doesn’t always show, but when it does, it can be useful confirmation of a binding working, a query running successfully, or a JS Object executing completely.
For widgets, you see which properties are updated when you are configuring them and how.
Say you’re updating the text widget’s background property and you don’t see it change on the canvas. Track the log to the response for a quick confirmation of that and troubleshoot the canvas next.
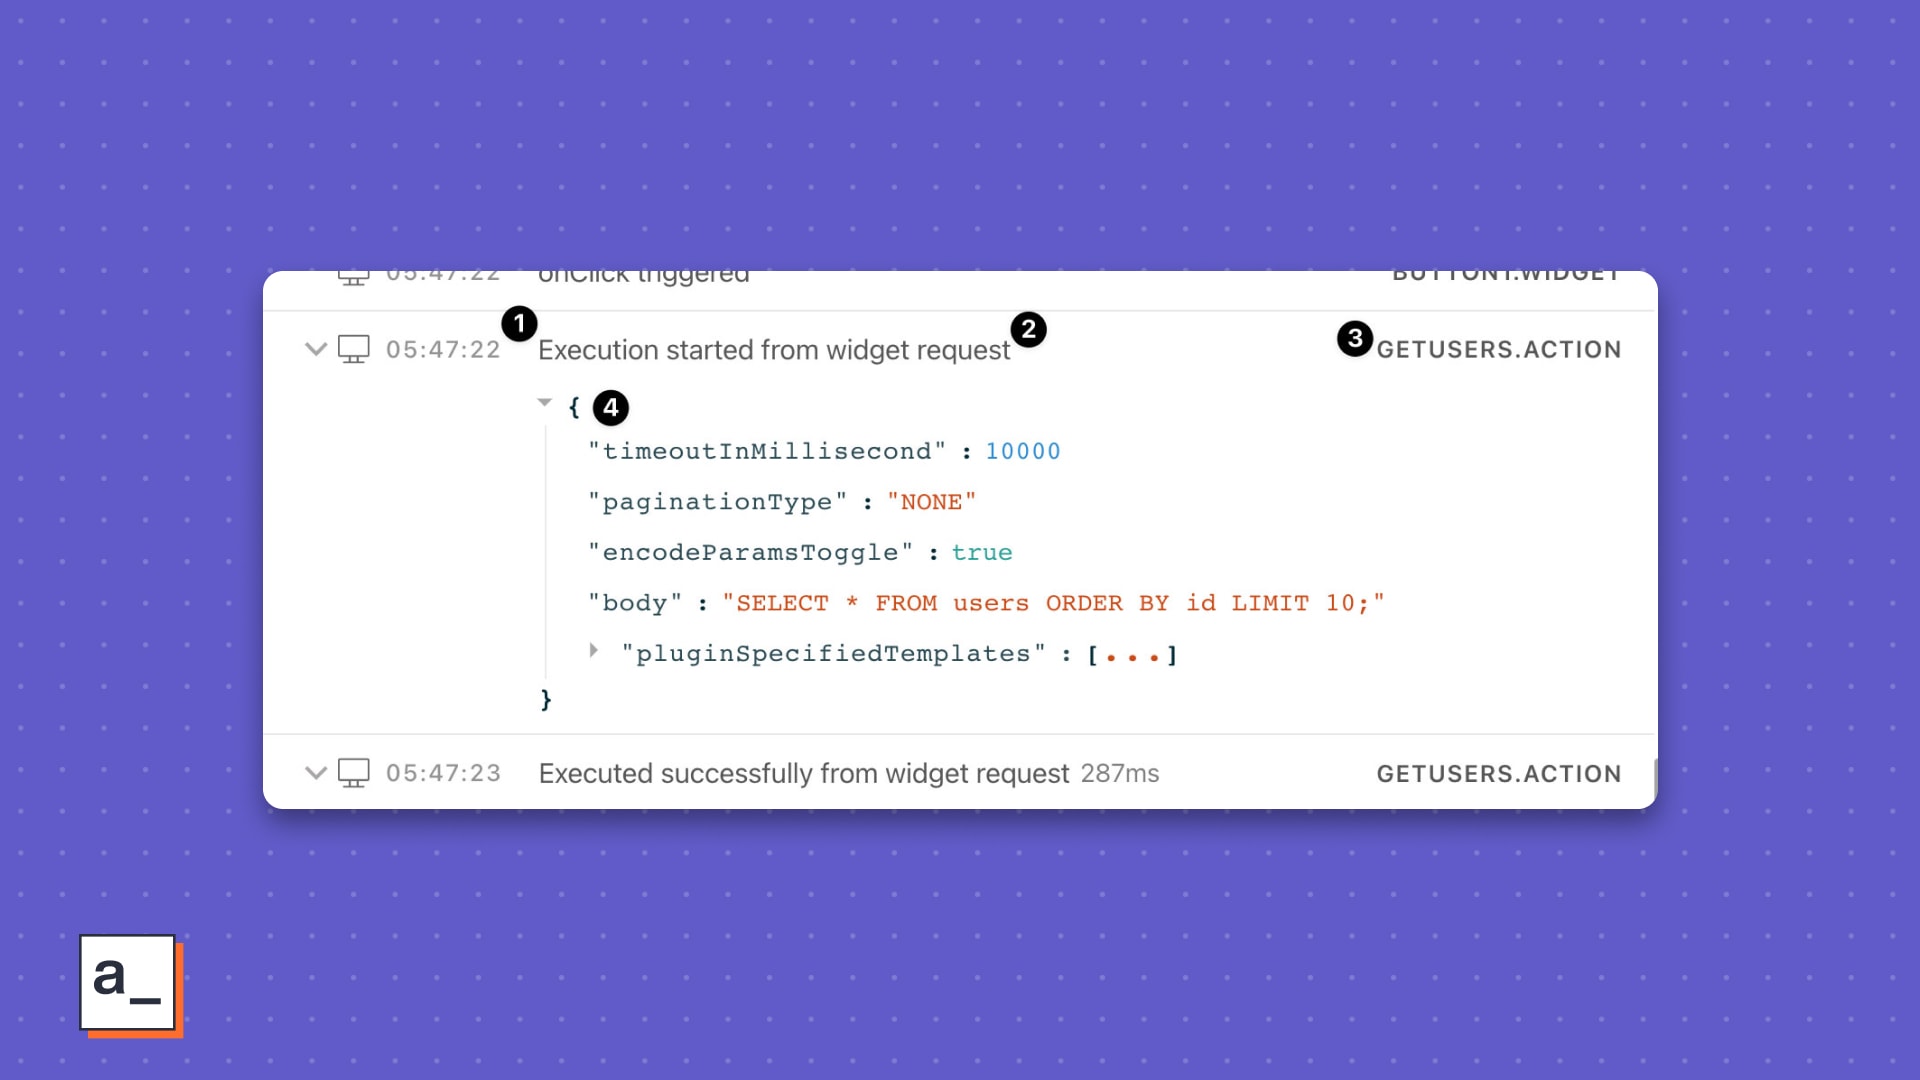
For queries, you’ll see two different logs—the start of a query run and the status of its execution.
The first type of log will show you configuration details of the query—helpful to verify if the config matches the request.
 {
            "timeoutInMillisecond":10000
            "paginationType":"NONE"
            "encodeParamsToggle":true
            "body":"SELECT * FROM public."users" LIMIT 10;"
            "pluginSpecifiedTemplates":[
                0:{
                    "value":true
                }
            ]
        }
The second type will throw an error if the run fails. When the query runs successfully, it shows all the parameters that the query ran with and the time taken for the response.
     {
        	"response" : [...],
        	"request" : {
        		"actionId" "6321c1193668£71e£7caala2"
        		"requestedAt" : 1663912830.640344
        		"requestParams": {...}
        }
With JS Objects, you see the response from the function as a JSON after an object is successfully run. This shows you how Appsmith handles the function while evaluating and running it and can be useful for spotting conflicts, undefined references, or troublesome variables.
Inspect Entity
Borrowing from a modern browser’s Inspect element feature, Inspect Entity lets you see incoming and outgoing entities for any widget. These entities can be queries, JS Objects, or even other widgets.
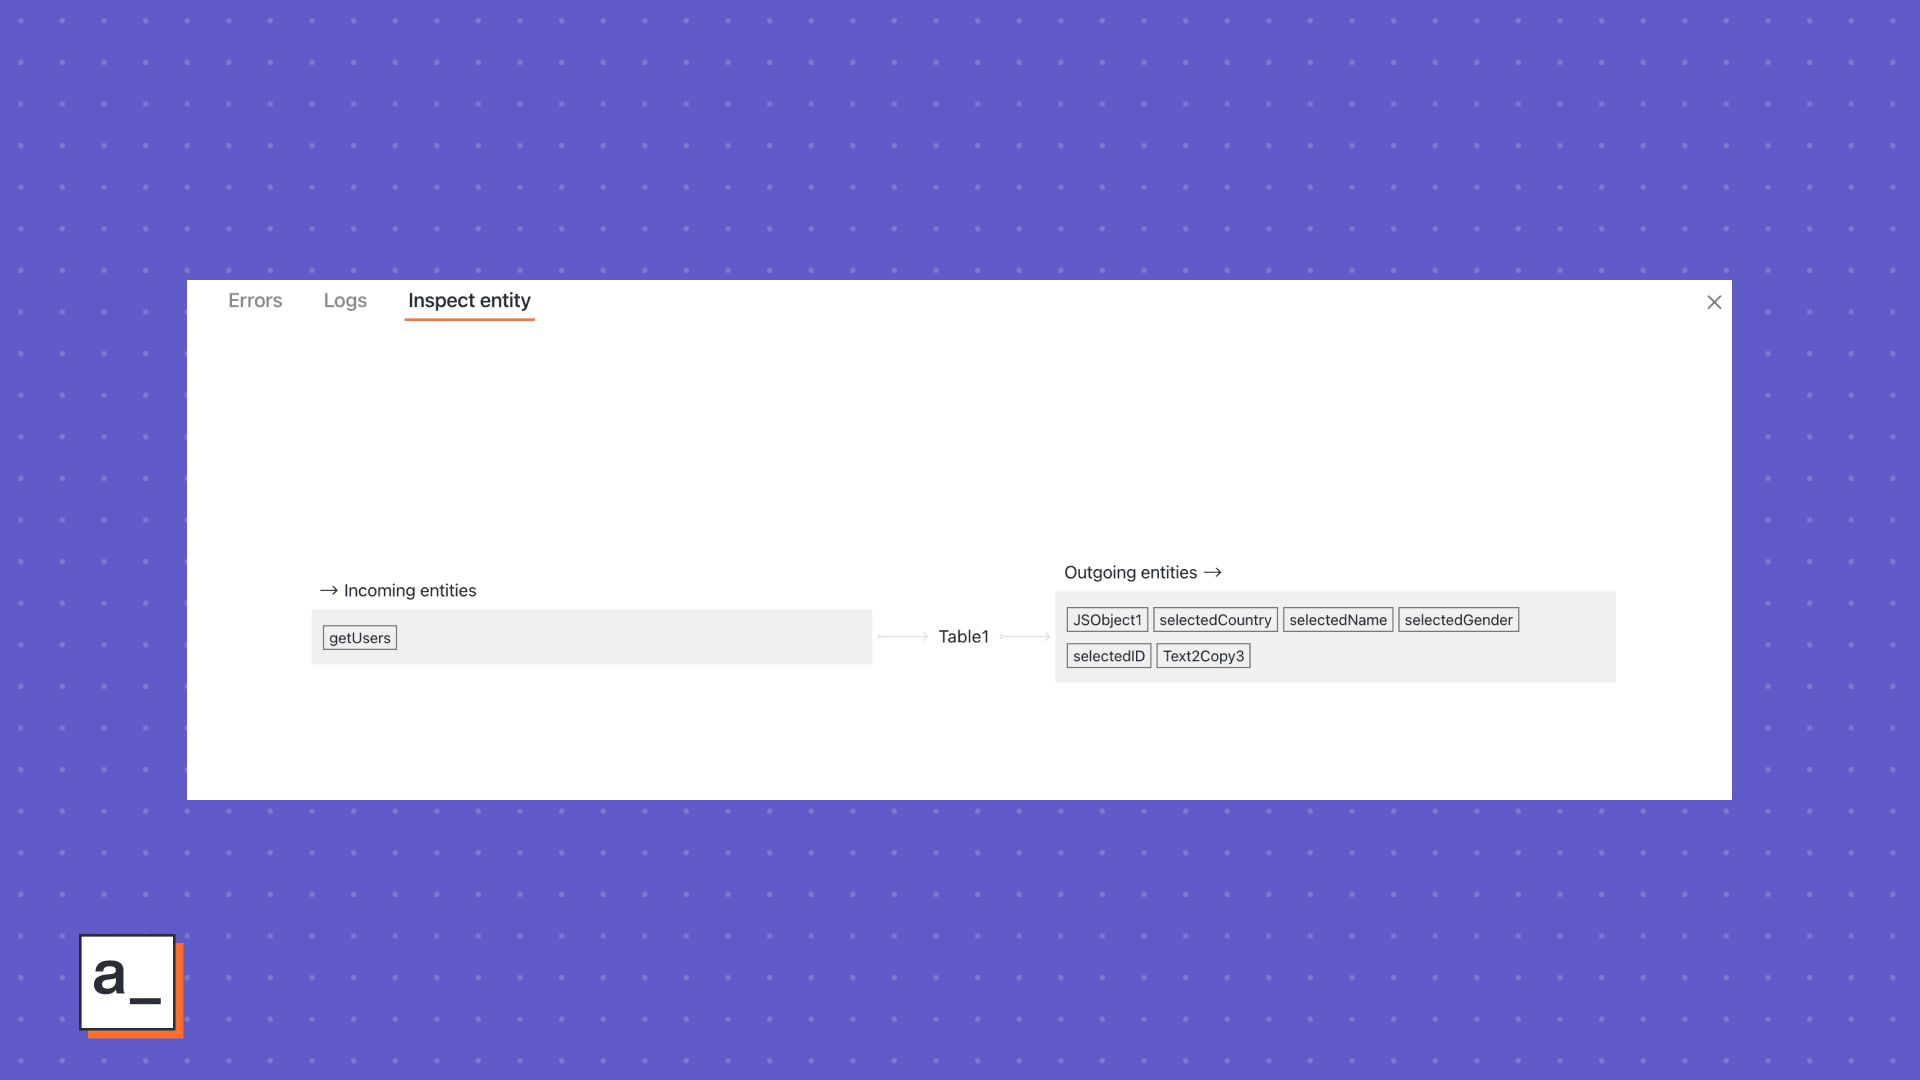
Incoming entities are those that fetch data from the datasource into the widget. For example, if the data on a table is populated by a Postgres query, you’ll see the query name under the
Incoming entitiescolumn.Outgoing entities are those that can specify the data that’s to be sent to the datasource in a typical CUD operation and then send it to your datasource. Say, a text widget is binded to the
Table.selectedRowproperty, you will see the Text widget’s name under the Outgoing entities column.
Like Inspect element, the Inspect Entity pane lets you see dependencies for all your widgets on the canvas, especially useful if you have a medium-complex app with several widgets working off of each other. The pane also lets you click through to the entity you are interested in—a query, an object, another widget—instead of searching the entity on the Explorer to the left of the canvas.
When widgets are sharing data, and they don’t show up rendered data from bindings, you can navigate to the issues with single click from the inspect entity.
And that’s it. If you have got here, we would love for you to try the Debugger and let us know if the two-part teardown does justice to its usefulness. If so, share this article with a friend. If not, share it with an enemy and tell us our areas of improvement.
Related Blog Posts