Meet the Table: A React table for building internal apps fast


The Table is one of our top widgets by usage. Even with 25% of our users sending us telemetry data today, it has been used more than 820,000 times since we launched it. 🤯
Built on React Table
There are several popular libraries for building React tables, including our favorite and the massively popular, the React Table. We like it so much we sponsor it and can’t thank Tanner enough for building it.
We built our Table on top of it to help build internal apps lightning fast with ready features to support most popular use cases—an admin panel, dashboards, monitoring apps, and more—with out-of-the-box support for styling, theming, and in-line editing. You can also have a read about this article on building a react admin dashboard.
Let’s get into it
This post tears the upgraded Table widget down to all its component features and how you can use them. While our example today is an admin panel for a MakerPad-clone on Postgres, you will see how to build an admin panel for any datasource or other apps like dashboards, portals, and even CMSes.
Let’s go.
“”💡 Toolspace, our MakerPad-clone, is a discovery app for open-source projects built on Postgres and Django. The Appsmith admin panel runs CRUD operations to the Postgres database for categories, alternative projects, data, and users. You can also read this about Django admin panel.
Present tabular data
The Appsmith Table is familiar with a few powerful differences right out of the gate to help you leapfrog over typical web table set-ups.
One binding to bring it all
Assuming you have already connected your datasource and set up get queries to fetch data, it takes one small change—a binding—your freshly dropped Table to present the data.
Easy views for your data
You can write JavaScript almost everywhere in Appsmith. This comes handy when you want to create a view of your data for your app. Extend your Table Data binding with something like ↓
{{
getAllProjects.data.map((item)=>{
			return {
				"id": item.id,
				"name":item.name,
				"slug":item.slug,
				"logo":item.image_url,
				"github_url": item.github
			}
		})
}}
and voila! Your Table now shows the view you want. Use the Table Data property to manipulate your views any time. ☝ For easier code editing, we recommend you write longer code in a JS Object and reference it in the Table Data property.
Data to Table to data
Data exists as text, images, videos, URLs, and others on your database. Easily map datatypes from your database from the Column Type property under each column’s settings. This mapping is also used to update your database, as you will see later in this post.
For binary state values in columns—true or false, really— the Checkbox or Switch column types make it easy and visual for your end-users.
“”👌🏽 The Table supports over ten column types, including interactive components like buttons and icons. We talk about them below.
All in the names
Your database may have column headers that aren’t the best for your users, e.g., github_url. Edit those headers right on the Table as you would a filename. Double-click, type in your preferred header, e.g., GitHub URL, for each column, and done.
What’s the value
Sometimes, your data isn’t in a single-entry-per-cell format. In our example, the alternative_products column has several related items per tool, so the column shows up as [], indicating an array.
Computed Value under column settings for each column translates the value in one swift binding to show that number.
{{ currentRow["alternative_products"].length }}
👉 Computed Value supports JavaScript methods and functions—all of them.
Peek-a-boo columns
Often, you find columns you need to build and run your app—e.g., slug, that end-users don’t need to see. One-click on the eye per column on the Property pane, and you are done making them invisible to your users.
👉 Scroll horizontally to find hidden columns after the last visible column when you are building your app. Your end-users don’t see them when you deploy the app, though.
Order, order
Rearranging columns to present information hierarchically to your end-users is just a simple drag-and-let-go thing under Columns on the Property pane.
Prettify it
The Table recently got themed, so you can now choose a default or a custom theme for your admin panel and see the Table get a personality in one click.
Unlock higher degrees of personalization for pixel perfect matches to your brand guidelines.
Color cells by column values with conditional styling using single or nested conditions in JS toggles available under the
Styletab inside column properties.
{{
function() {
  if (currentRow.alternative_products.length == 0) {
    return "#E87171";
  }
  if (currentRow.alternative_products.length == 1) {
    return "#84cc16";
  }
  if (currentRow.alternative_products.length > 1) {
    return "#3b82f6";
  }
}()
}}
Control row height—short, default, tall—, text size—small, medium, large, extra-large—, and text alignment—left, right, center, top, bottom—by the number of items you want to show. No-code needed.
Customize borders and shadows for the entire table for consistency with your brand styles.
Get your rows in a duck page
Showing all your rows in one endless scroll isn’t the best end-user experience and loading it is a chore for your browser.
Magically paginate your apps with two out-of-the-box methods in Appsmith.
The
pageNoandpageSizeproperties simplify pagination out of the box for queries and APIs.The response-URL method relies on server-side pagination and is simpler for endpoints that have paginated URLs.
Make your data accessible
Presenting the data isn’t enough, especially when you have more rows than the lines of code you have written so far in Appsmith.
The Table makes accessibility easy and delightful.
Wrap it up
Toggling the Cell Wrapping settling on under Column settings lets your end-users see long text and evaluated values of dynamic bindings without scrolling or double-click gimmicks.
Search for it
Tables in Appsmith come with pre-built Search for all your data, paginated or otherwise. Search runs automatically each time you enter or change a keyword in the Search box.
Easily configure it one of two ways.
Write a search query with keywords like
ilikeorfinddepending on your database.SELECT * FROM users WHERE name ilike '%{{Table1.searchText}}%'Use query params dynamically with your API like ↓.
https://api.toolspace.dev/api/all-xyz/?search={{Table1.searchText}}
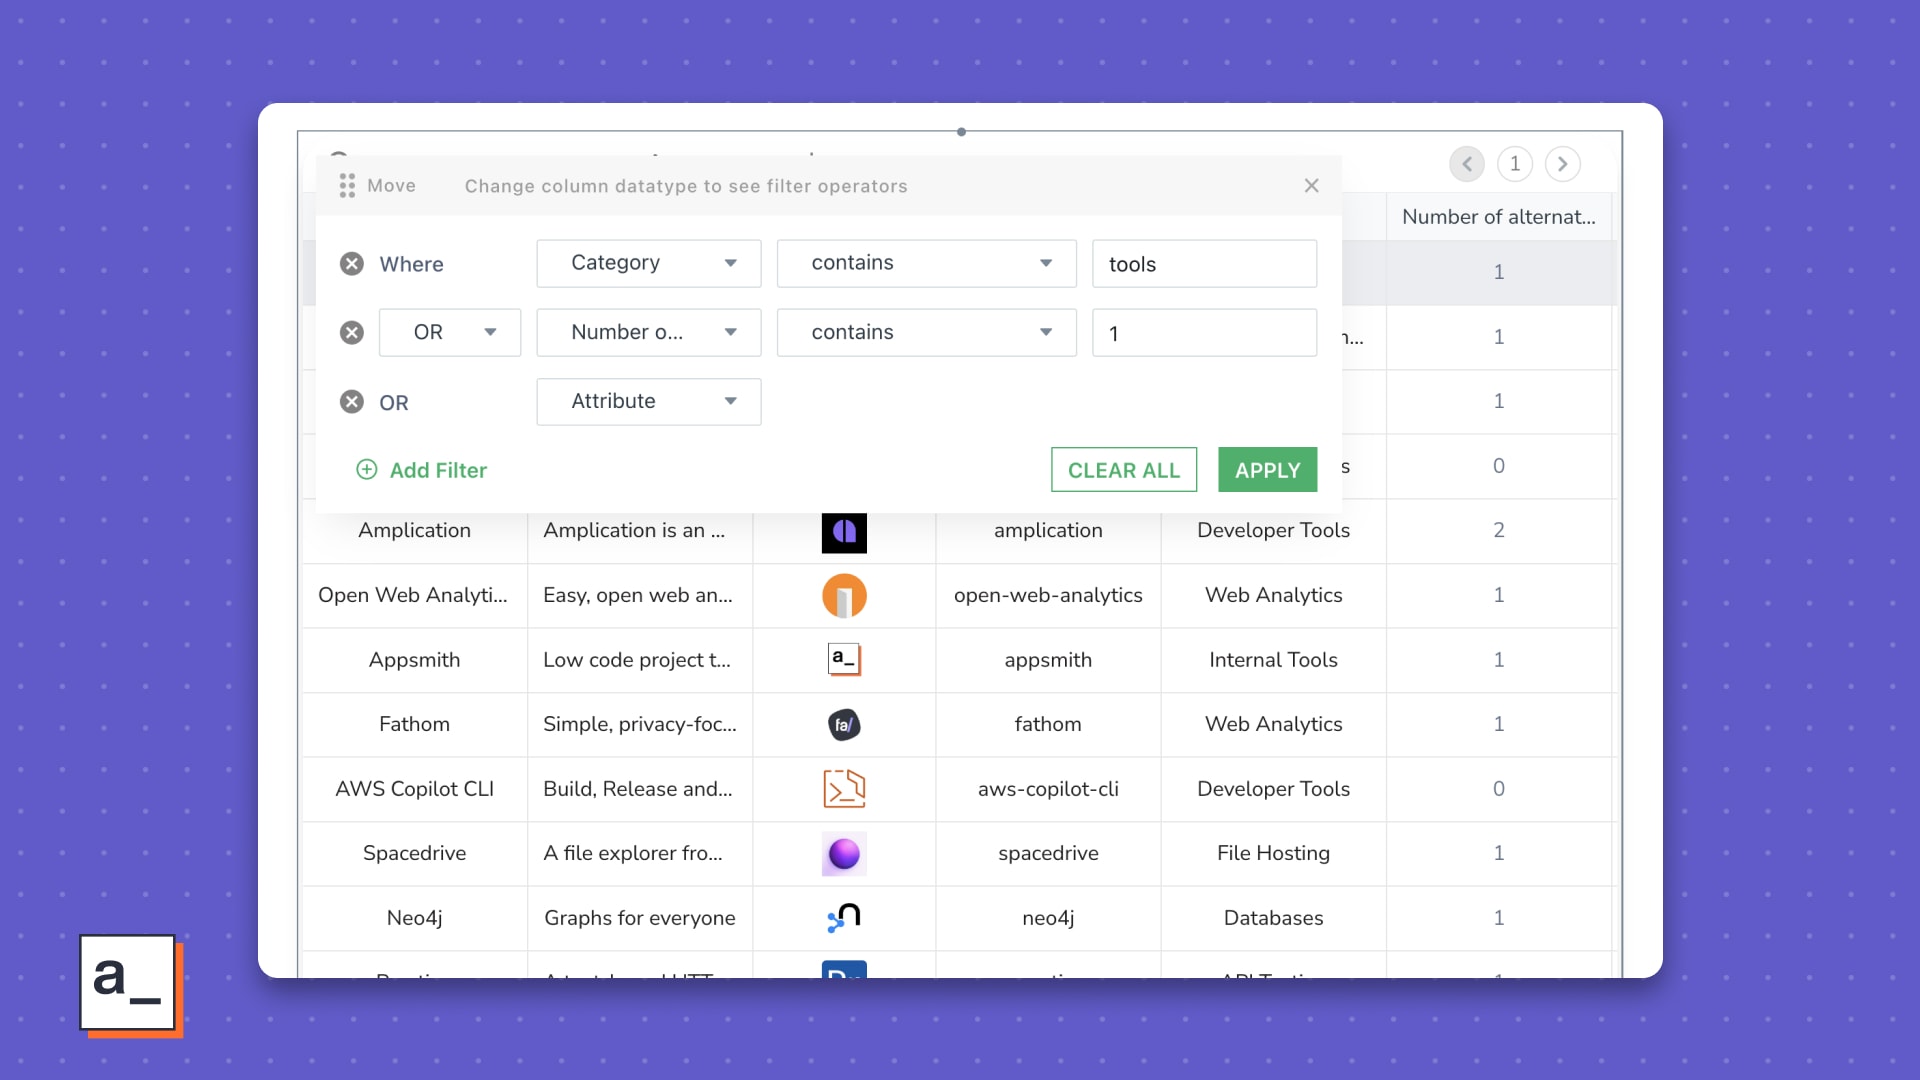
Sort and filter
While sorting your data takes just clicking column names or headers, filters offer a little more power to you.
Select a column, add a filter condition, and done—just like a spreadsheet.
Add
AND,ORconditions for advanced filtering—just like you would in an analytics tool.

Get a good view
Build unique views for better data presentation with table properties and triggers.
Spreadsheet view Use tabs to display multiple tables or filtered views of your data.
Details view Show detailed views of your data on off-table components like Modal, Input, and Text widgets.
onClick-trigger them with Buttons, Icons, or Menus in a column.
Menu buttons are especially useful to nest both view and delete triggers in one component—good for when you want to let familiar end-users delete data easily.

Nifty Appsmith-native properties like
selectedRow,triggeredRow, andselectedRowIndexmake it super easy for you to dynamically open details views and, as we’ll see later, even edit them when you swap out the Text widget for an Input widget.
Run update queries using buttons to perform edit operations.

Did we mention already you can set intervals for auto-data refresh? No? Well, ↓ is all it takes.
{{
// runs for every five seconds setInterval(() => {
	 getAllProjects.run()
}, 5000)
}}
Two-click data export
Exporting your table data is, like most things so far, an affair of clicks for two of the most popular types—CSV or Excel.
Add-edit-delete your data
So far, we have built a pretty functional, pretty pretty data viewer. This last set of features turns a viewer into a full-blown admin panel.
Add to your data from views Use a Modal + an Input widgets, triggered from a column type or a Button outside of the table to open a set of blank input fields that save data entered with an
onClicktrigger.
Edit from views
Remember the unique views you built for your data? Extend those views to make them editable with Input + Button widgets instead of the Text widget. All changes to your fields get updated with the Button’s
onClicktrigger binded to an update query.
Delete from the Menu We configured a delete trigger in our Menus before. Let’s put that to good use.
And, drumroll, please, you have a full-blown admin panel in under half-an-hour! 🥳
But wait, what if…
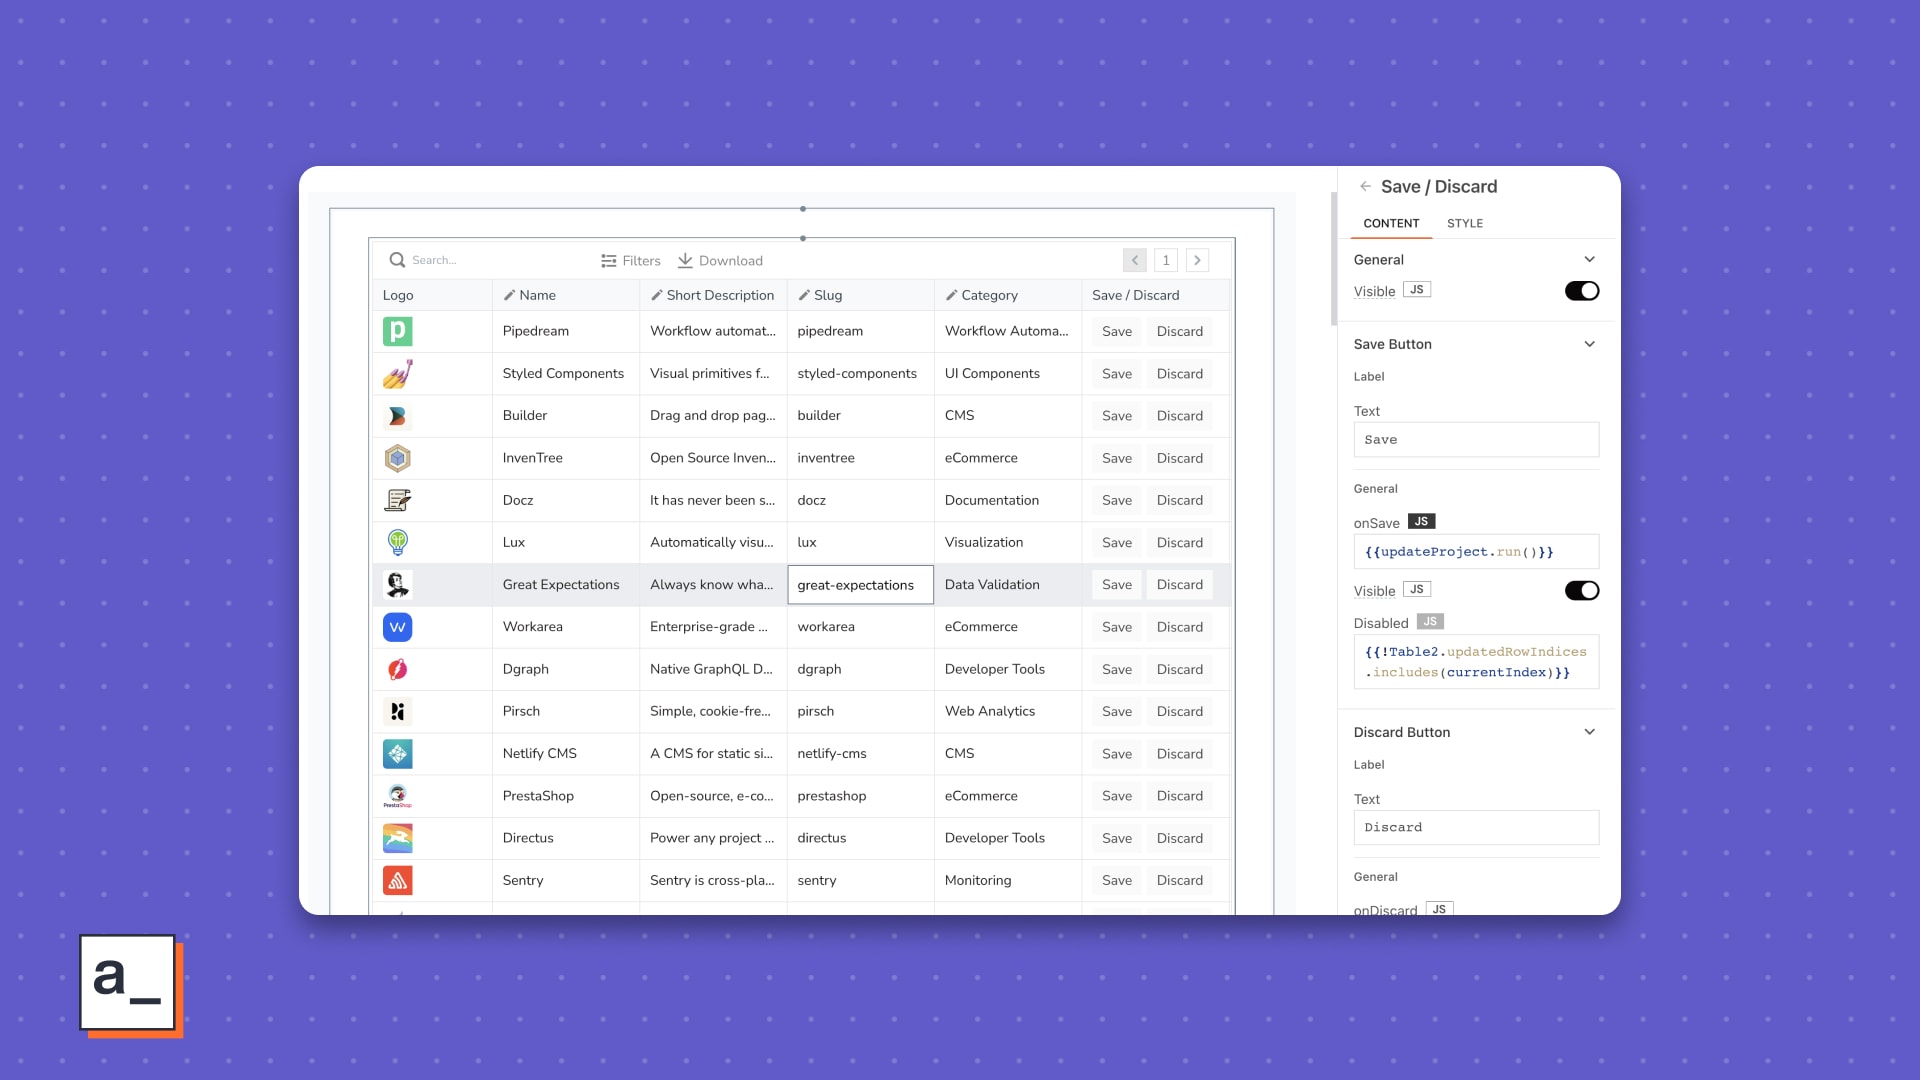
Inline editing without inline code
…your awesome admin panel could let your end-users edit data like they would on a spreadsheet?
Inline editing does just that. With your query for updates to your datasource built, all you need is to,
make your columns editable, and
bind the query to the
EditActionscolumn type—shown as theonSaveproperty.Your users then just do ↓.

Where the Table’s going
The Table has come a long way since we launched it many, many release cycles ago. Little did we think it could potentially become a CRUD app builder on its own. Which it is quite nearly now. So, we are building more and more on the table ourselves and asking, “Can’t we really turn this into an end-to-end app builder?”
You are welcome to stay updated about our tries or even contribute, but don’t let either of those stop you from using the Table, say, for an admin panel to a directory or for powering a dashboard for multiple datatypes and sources or even a whole support app like ours.
Go for it. Your seat at the Table is waiting.
Related Blog Posts