Build a GitHub Dashboard to track any open source project

Did you know that Appsmith is a fully remote distributed organization? We have colleagues in 5 countries! This makes total sense for us as an open-source platform with contributors from over 100 countries (take a look at our activity on Github). It’s also why we think of ourselves as learners; we read, talk to people, and love feedback. And in that spirit, every new team member makes an app on Appsmith in their first week upon joining us! And there is only one rule, that there are no rules! These apps range from functional to fun to downright silly! This week, we’re featuring our colleague, Favour Ohanekwu’s app. Favour is a front-end engineer from Ibadan in Nigeria. Over the years, he has been actively involved in building web applications across several industries ranging from health, agriculture, and IoT. You can follow his work here.
Narrowing down to building a Github Dashboard
Favour toyed around with a few ideas before landing on a final app idea. Some of these app ideas were:
An application that allows employees to review their team members and view reviews about them from their fellow team members.
An application that shows the current availability status of each employee at any time of the day. On this application, employees will be able to set their status (Active, Busy, Away) and be able to see the current working status of other team members.
A dashboard that reports the company's GitHub repositories and compares them in terms of several metrics.
Favour chose to work on the third idea to build a Github Dashboard to view and track several projects, using Github’s REST API.
We’ll outline the steps involved in making this app, and you’ll see how easy it is to build this application in few simple steps using Appsmith!
Getting Started with the Github Dashboard
This short tutorial uses the cloud version of Appsmith. However, you can always export and import Appsmith apps to different environments (cloud, self-hosted, local). The recommended way to use Appsmith is to use Docker; follow the documentation here for detailed instructions if you want to build locally.
Create a new account or sign in with an existing account, redirecting it to our dashboard.
Click on Create New under your organization, and this will create a new Appsmith application.
Rename the application to GitHub Organisation Dashboard (or any name you’d like) by simply double-clicking on the existing one.
On the left, find the entity explorer; this is where you can manage all the widgets and data sources of the entire application.
Now you can build a simple UI with Appsmith widgets to build the dashboard and display all metrics crucial to your project!
Fetching Data from Github Organisation
Now that you’ve configured the app, you will need to configure a data source that will fetch all the repos from a Github organization. To do this, follow the steps below:
Click on the + icon next to the Widgets, find the input widget, and drag and drop it on canvas. The idea is to enter the organization name and dynamically fetch all the repos created under that organization.
Next, click on the + icon next to Data Sources, and create a new API as a data source. Rename the API as get_organization_repos and paste the following in the URL:
https://api.github.com/orgs/{{Input1.text}}/reposHere as you can see, we’re dynamically passing the organization name to the GitHub API from the input widget.
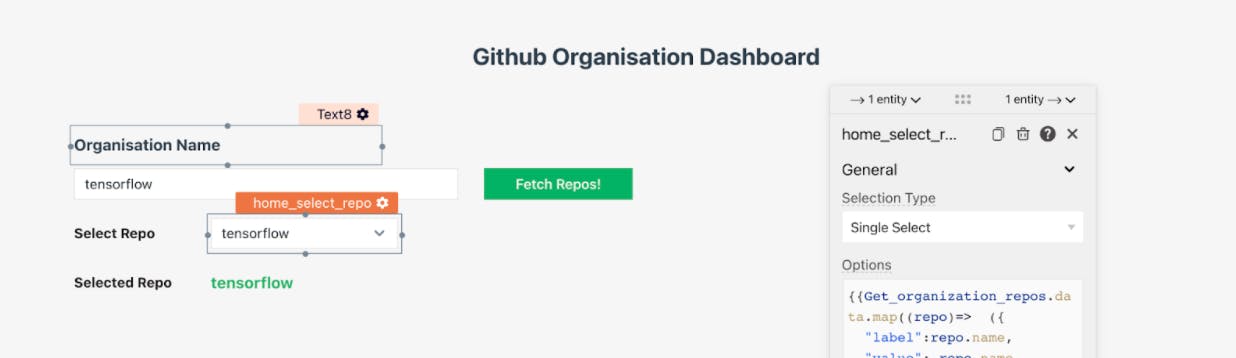
Go back to the canvas, and drag and drop a new Select widget; now paste the following snippet to pollute the options with repos in the select widget from the API.
  {{
    get_organization_repos.data.map((repo)=>     ({
        "label":repo.name,
        "value": repo.name
    }))
    }}
Drag and drop a new button widget and set the onClick action to Execute a Query and select the get_organization_repos
With this, whenever you enter a new organization name, the select widget automatically populates it with all the repos from that organization.
Additionally, you can drag text widgets and add some context regarding the same for the dashboard. Here’s how it looks:
Fetching Data and Events of a Particular Repository
Displaying Core Metrics
Now that the repositories are listed on the application, you can fetch the data of a single repository and display all the crucial information such as network count, forks, subscribers, and a few more.
Click on the + icon next to the Data Sources and add a new API and set the URL to the following:
https://api.github.com/repos/{{Input1.text}}/{{home_select_repo.selectedOptionValueThis URL will fetch the repo details; we’ll name it as get_organization_repo_details
Similarly, add one more API data source and name it as get_repo_events with the following URL:
https://api.github.com/repos/{{Input1.text}}/{{home_select_repo.selectedOptionValue}}/eventsFor both of these data sources, we send the repo name from the Select widget, which is named as home_select_repo, and the selectedOptionValue property will help access
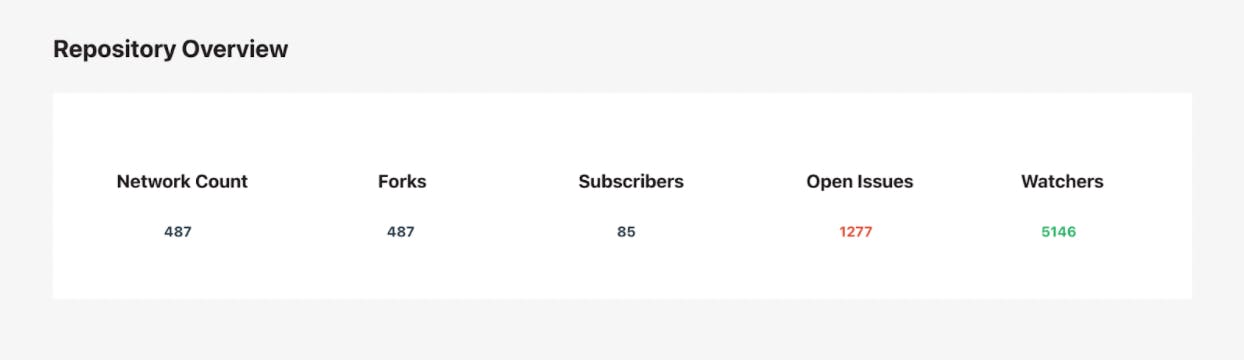
the selected option from it. You need to create a UI for displaying all the core repositories based on the selected option. For this, drag and drop a few text widgets onto the canvas, and set theValue property to the following:
TextWidget1 Value: {{get_organization_repo_details.data.network_count}}
TextWidget2 Value: {{get_organization_repo_details.data.forks_count}}
TextWidget3 Value: {{Get_organization_repo_details.data.subscribers_count ||"-"}}
TextWidget4 Value: {{Get_organization_repo_details.data.open_issues_count }}
TextWidget5 Value: {{Get_organization_repo_details.data.watchers_count}}
Additionally, you can add more text widgets and a container widget to organize this more beautifully. Here’s how Favour did it:
Displaying Repository Events
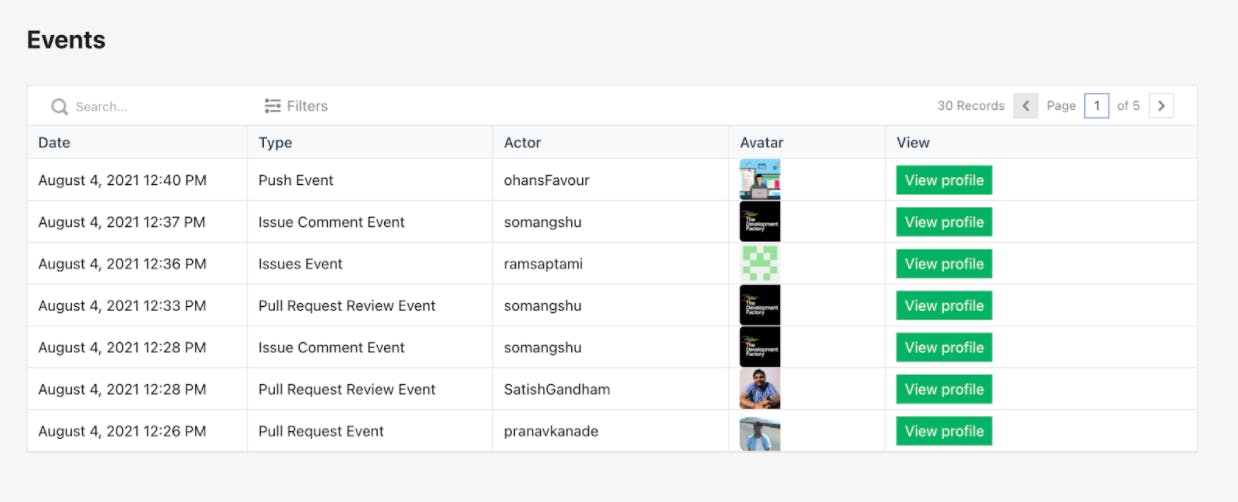
In this section, you can display a table widget to show all the events for a repository. This way, you can monitor who is creating pull requests, pushing new changes, etc.
Follow the steps below to do this:
Drag and drop a new table widget onto the canvas.
Open the property pane of the table widget, and set the following in the Table Data property.
{{
        get_repo_events.data.map(event => ({
            "Date": moment(event.created_at).format("LLL"),
            "Type": event.type.match(/[A-Z][a-z]+/g).join(" "),
            "Actor": event.actor.login,
            "Avatar": event.actor.avatar_url,
            "View": event.actor.url
        }))
   }}
With this code snippet, you can display all the data from the get_repo_events API and bind it on the table widget. Following is how the output looks like:
Displaying Statistics
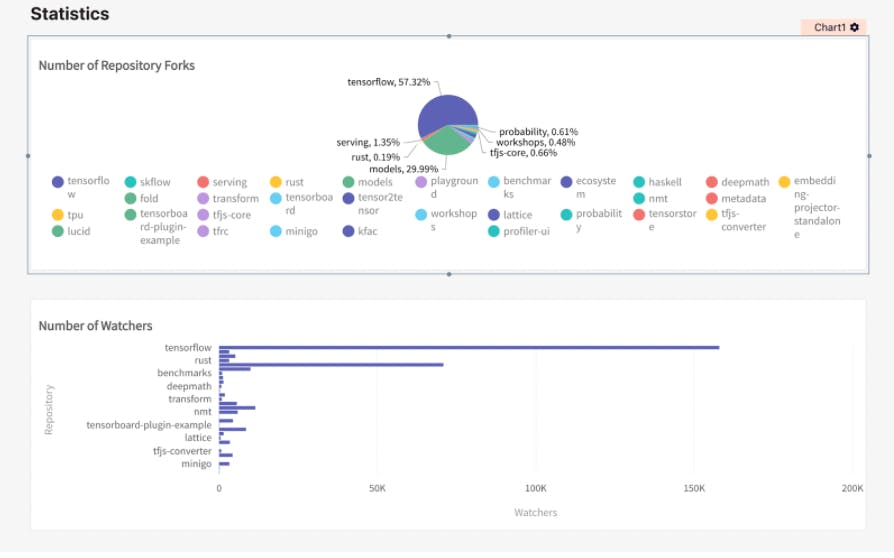
Last, you can add a couple of charts that will help you visualize the number of repository forks and the number of watchers for the repository by following the below steps:
Drag and drop a chart widget onto the canvas.
Set the title to Number of Repository Forks
Choose the Pie Chart under the Chart Type property.
Now create a new series and set the title as Repository Forks and add the following under `Series Data
{{
Get_organization_repos.data.map(repo=>({
  "x": repo.name,
  "y": repo.watchers
}))
}}
Similarly, add more chart widgets, set the chart type to Bar Chart, and set the Series Data to the following:
{{
Get_organization_repos.data.map(repo=>({
  "x": repo.name,
  "y": repo.watchers
}))
Following is a screenshot:
Now, wasn’t that easy to do with Appsmith?
Have you made something using Appsmith? Write to me (vishnupriya@appsmith.com), and I would love to feature you on our blog!
If you’re interested in building an app on Appsmith, sign up today. We have docs, and tutorials and live help, and a vibrant discord community to help you along the way. So go ahead, put your ideas out there! Do you want to join Appsmith? We’ve got a bunch of openings; take a look here and apply! Don’t forget to join our community and sign up for live events.