The Appsmith Debugger gets a console

For a while now, you have used and loved the Appsmith Debugger, nearly complete with a Error pane, system and error logs, and an entity inspector. We say nearly complete because it was missing one of the most popular debugging tools in a dev’s toolkit—console methods.
We are happy to announce the availability of console methods for both cloud users and self-hosters on v1.8.0.
“But, what is the Appsmith Debugger?”
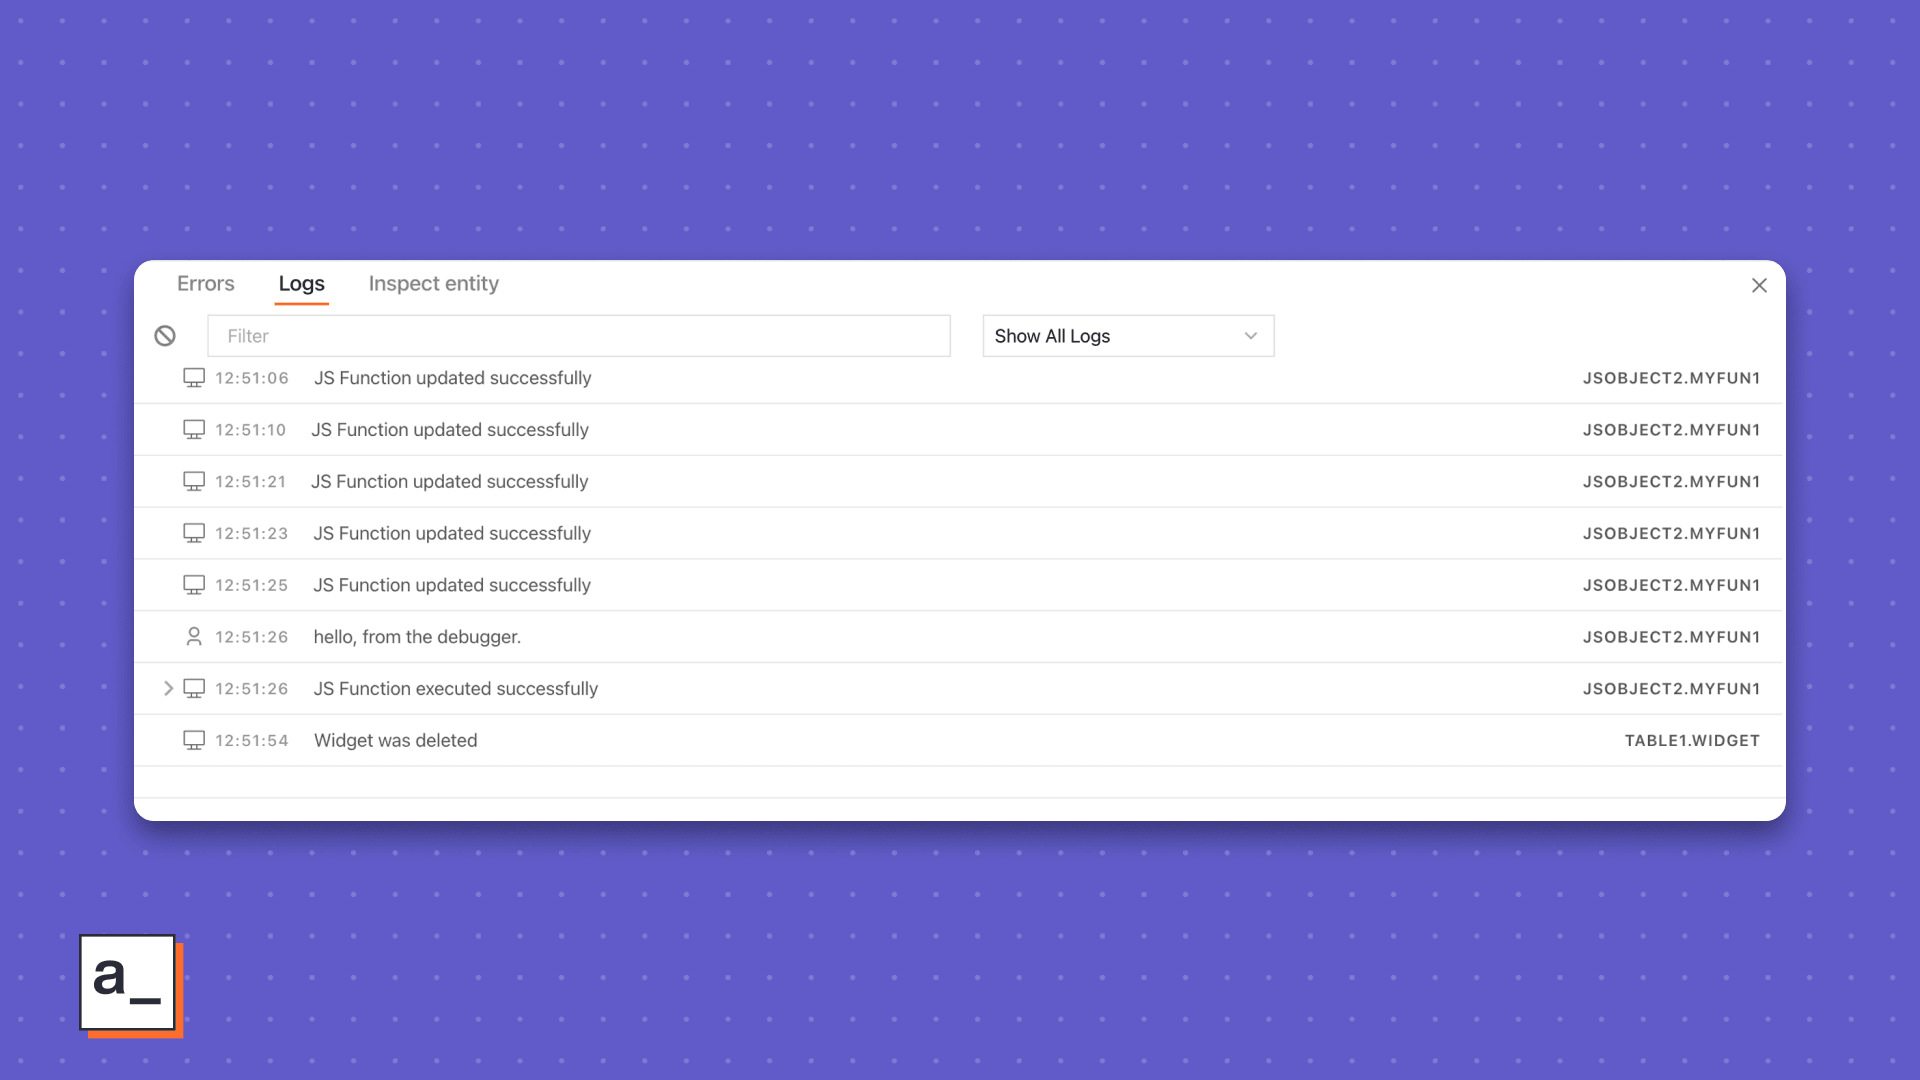
Think of the Appsmith Debugger as a set of Chrome DevTools—for Appsmith. It lives on the familiar 🐛 everywhere in Appsmith and
showed helpful error messages for bindings, queries, and variables
let you inspect entity relationships
filter system and user logs
All of this is helpful when debugging unexpected API responses or app viewer experiences. Should you care to learn more, this post breaks down the debugger by each one of its features.
“Okay, and console methods are…”
Just one of the most popular ways of print debugging in modern browsers, console methods, exposed by the console API, are a set of functions that help you log the values of variables at set points in your code, messages, or even tabular data so you can investigate them in your browser’s debugging console.
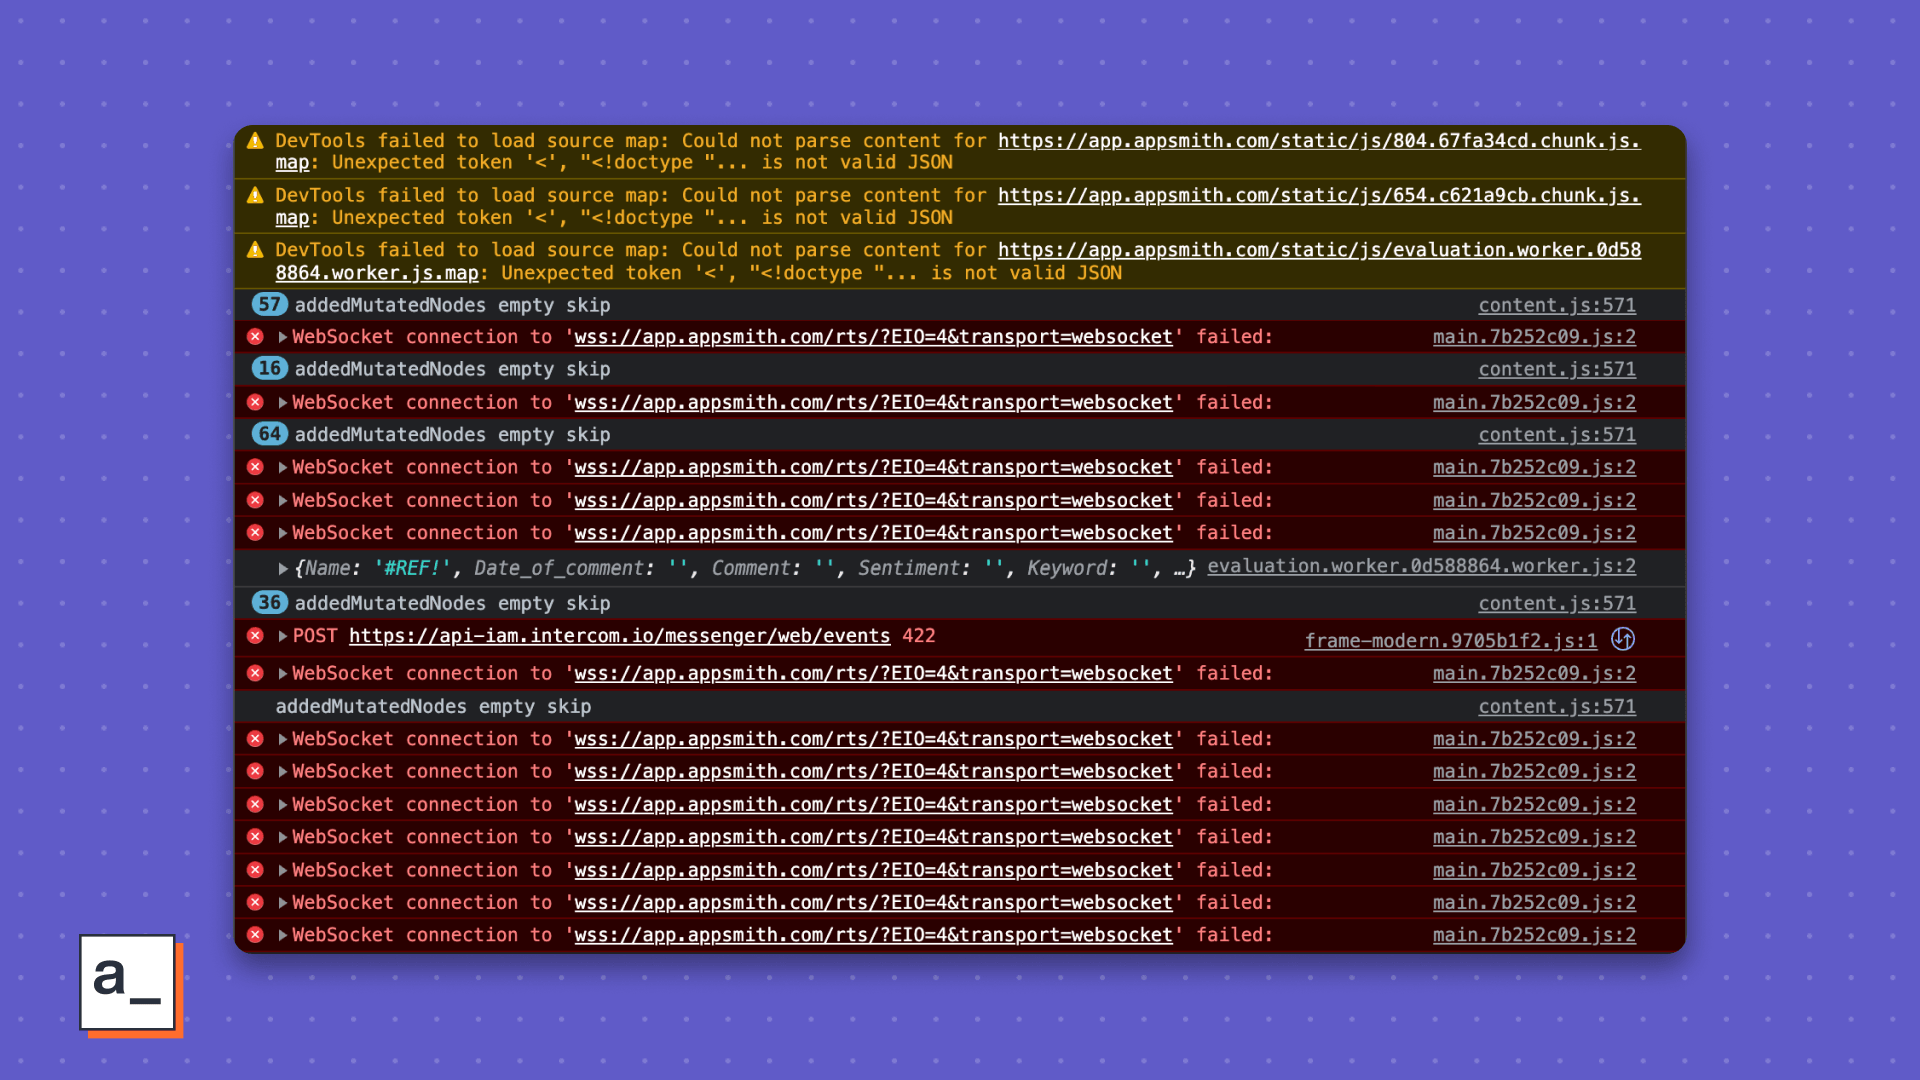
Before today, you could use all supported browser console methods, but only in the browser’s dev tools sub-window. To any developer with their hands dirty with front-end code, the browser debugging subwindow is a necessary evil—a thousand lines of errors, messages, values, and steps that you would have to sift through. We are not going to say, “Looking for the literal needle in the haystack”, but you know you are thinking it.
“And the Appsmith Debugger has a console now?”
Yes! 🥳
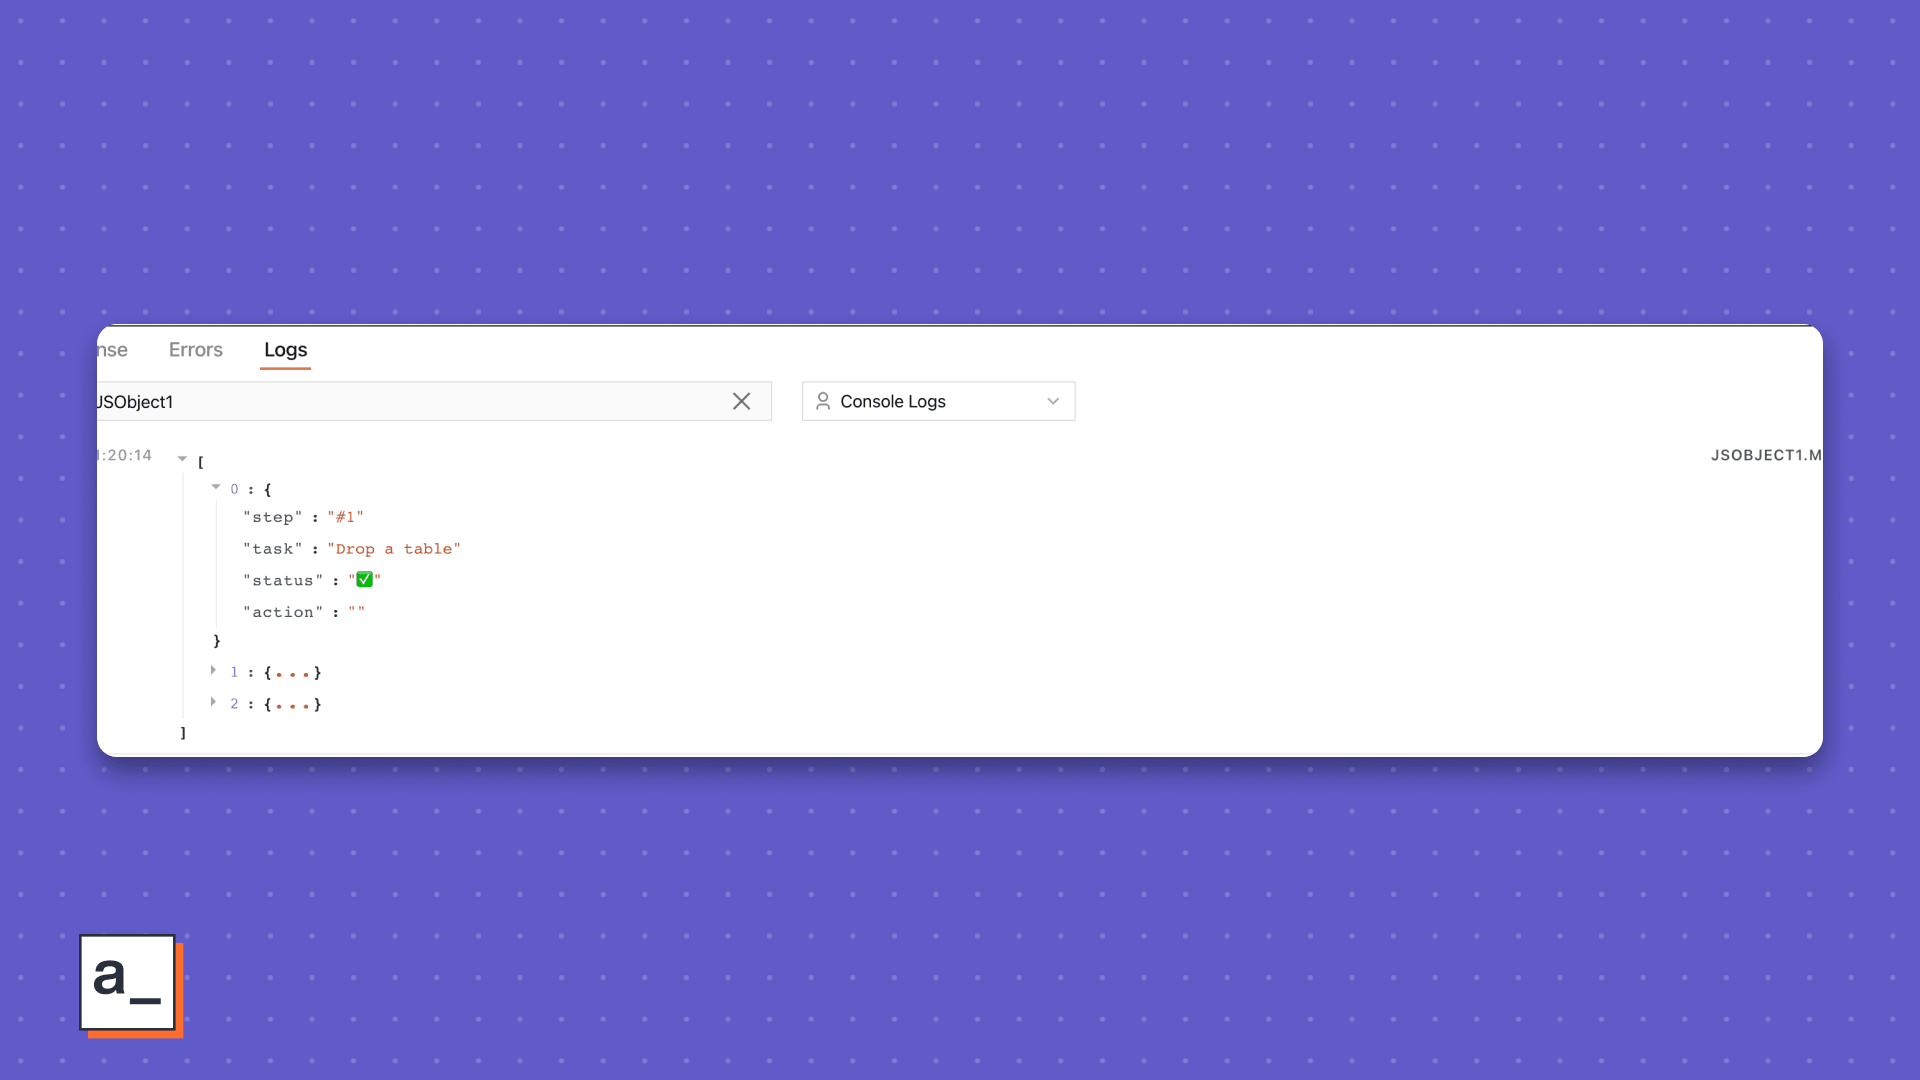
So, instead of something like,
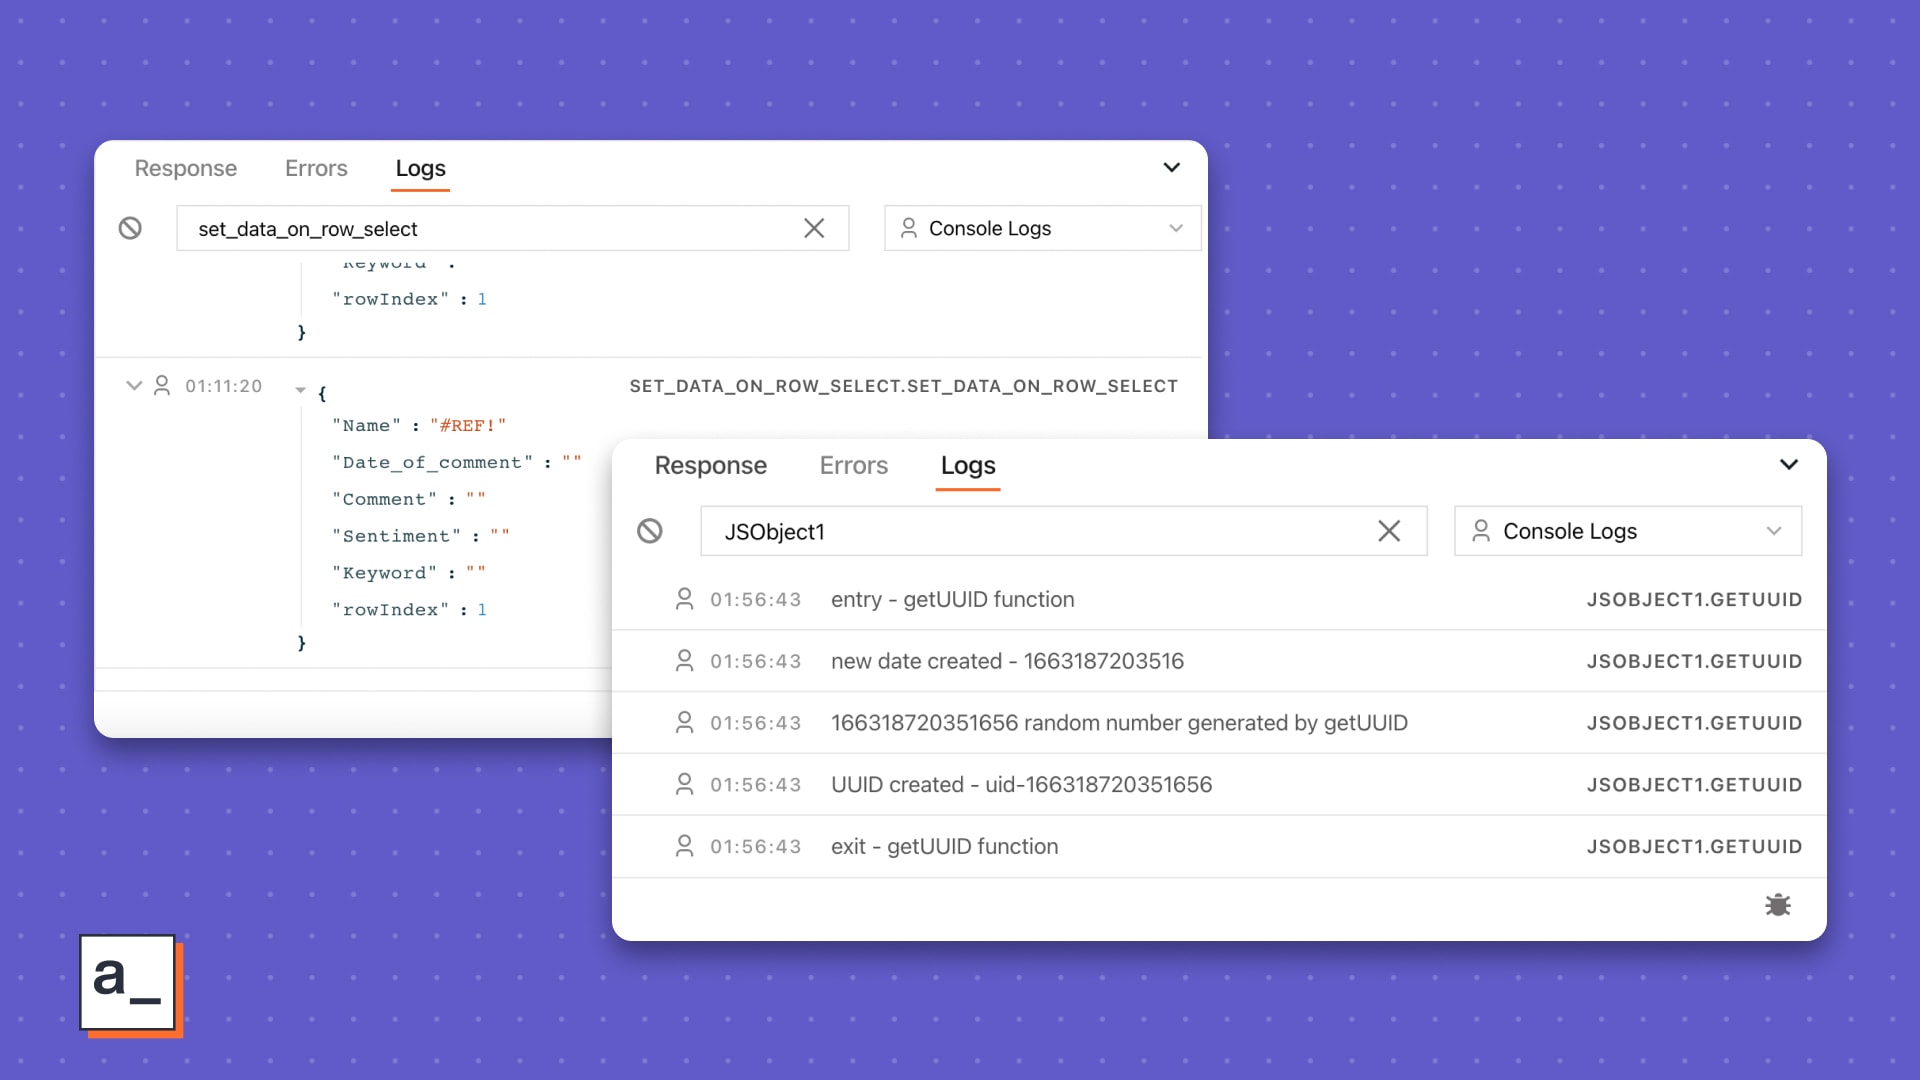
you now see,
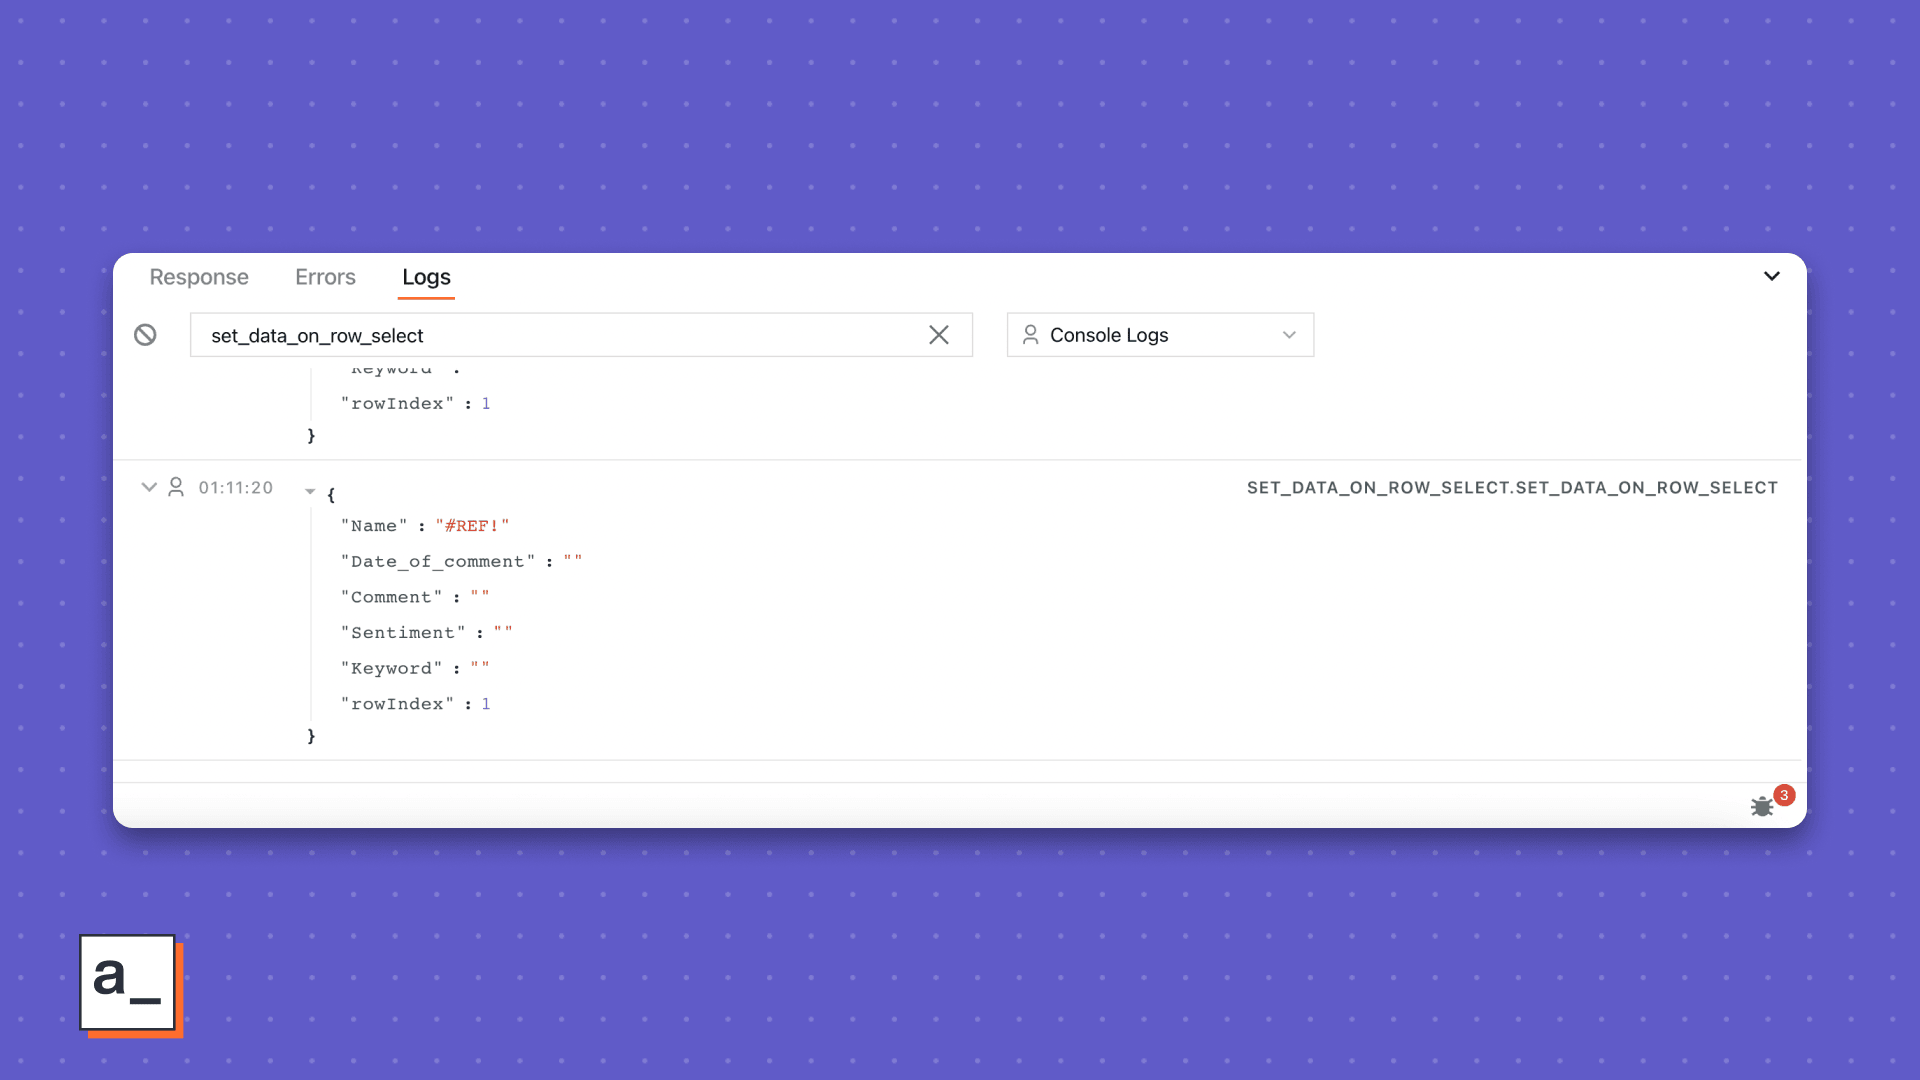
Sweet? This gets sweeter.
Supported methods
log
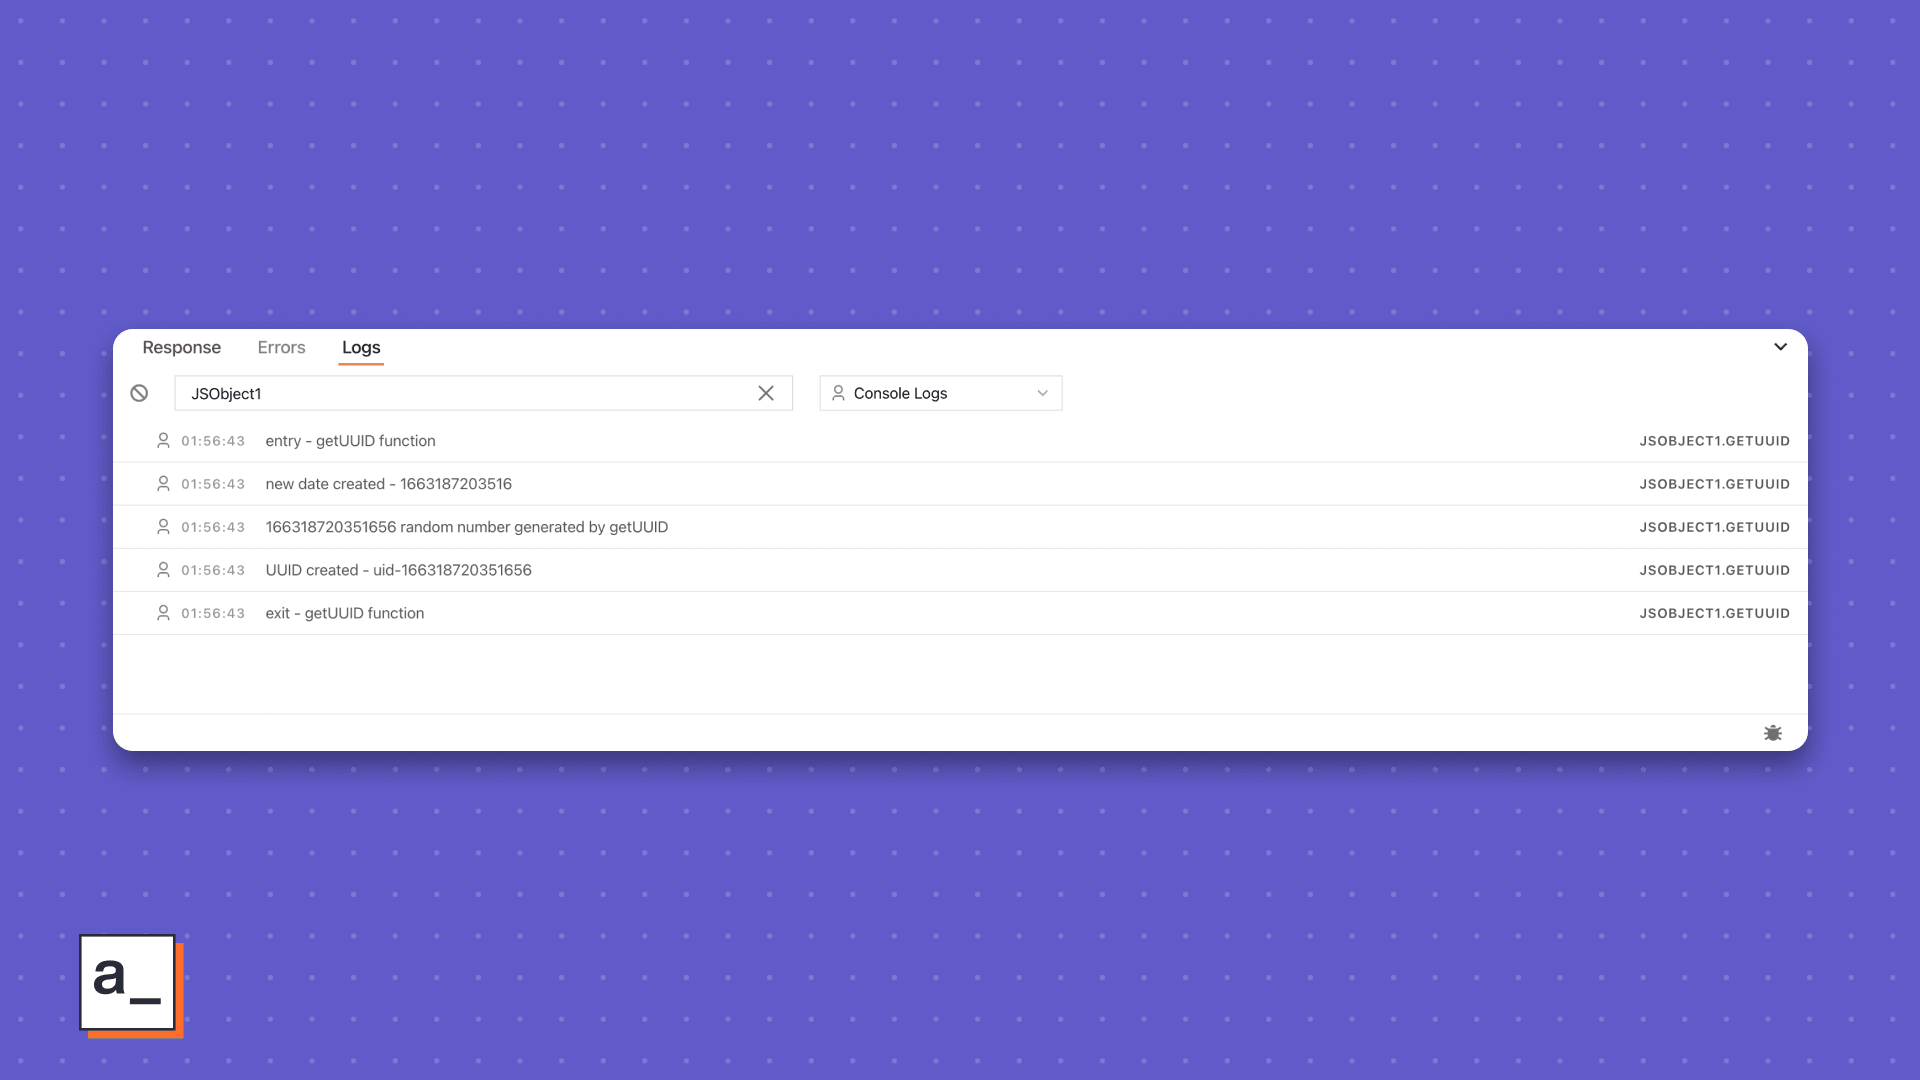
Almost synonymous with console, the **.log()** method is one of the most popular ways to log a message or the values of variables defined in your Javascript.
It can also be used to show helpful messages or comments, say, the entry and exit points of functions.
Example
getUUID: () => {
		console.log("entry - getUUID function");
		let prefix;

		let d = new Date().getTime();
		console.log("new date created -", d);
		d += (parseInt(Math.random() * 100)).toString();
		console.log(d, "random number generated by getUUID")
		if (undefined === prefix) {
			prefix = 'uid-';
		}
		d = prefix + d;
		console.log("UUID created -", d);
		console.log("exit - getUUID function")
		return d;
	}
Result
error
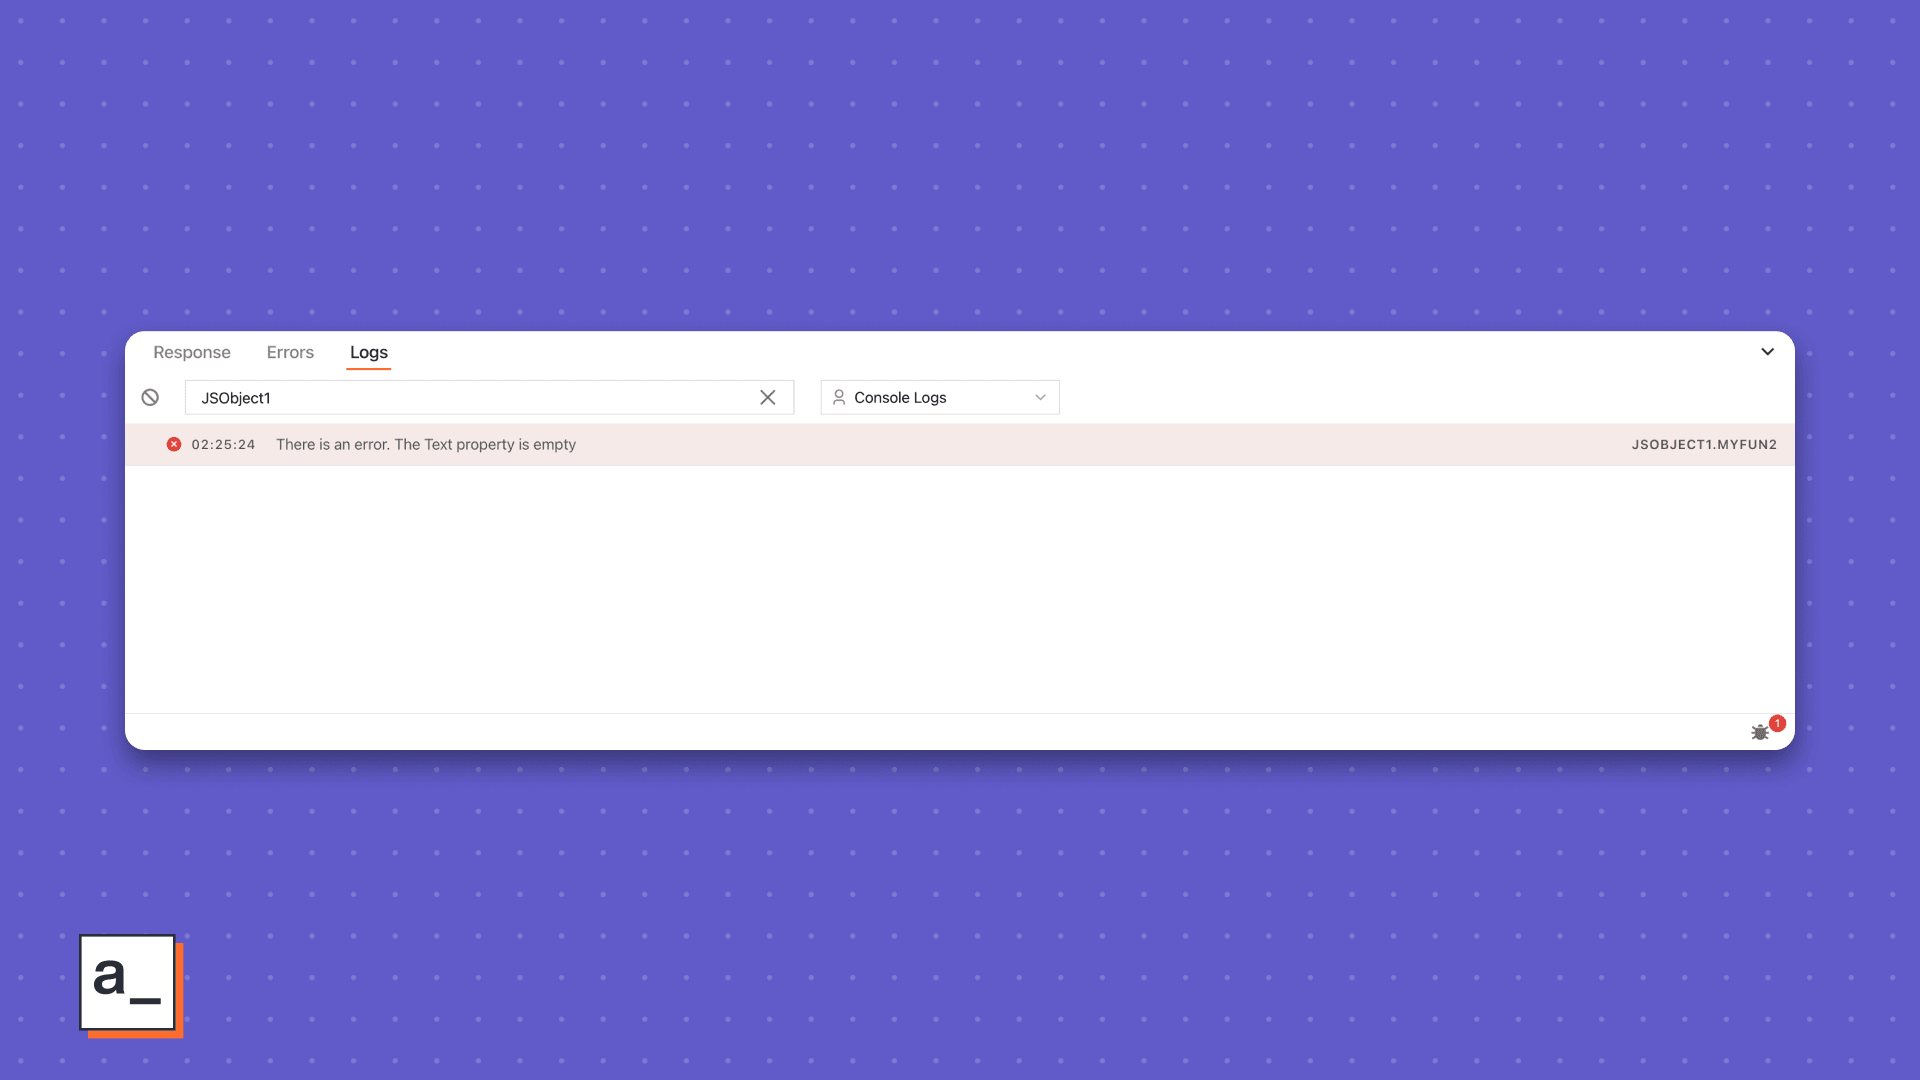
the **.error()** method logs an error message to the Appsmith console, be it a a string like, “This is an error message” or the value of a function.
Say you've written a function and you suspect it’s returning an error., but you don’t know what kind. For unknown unknowns like this, `error` comes handy. Example
checkTextWidget: () => {
		const element = Text1.text;
		if (element == "") {
			console.error("There is an error. The Text property is empty ");
		}
		return element;
	}
Result
warn
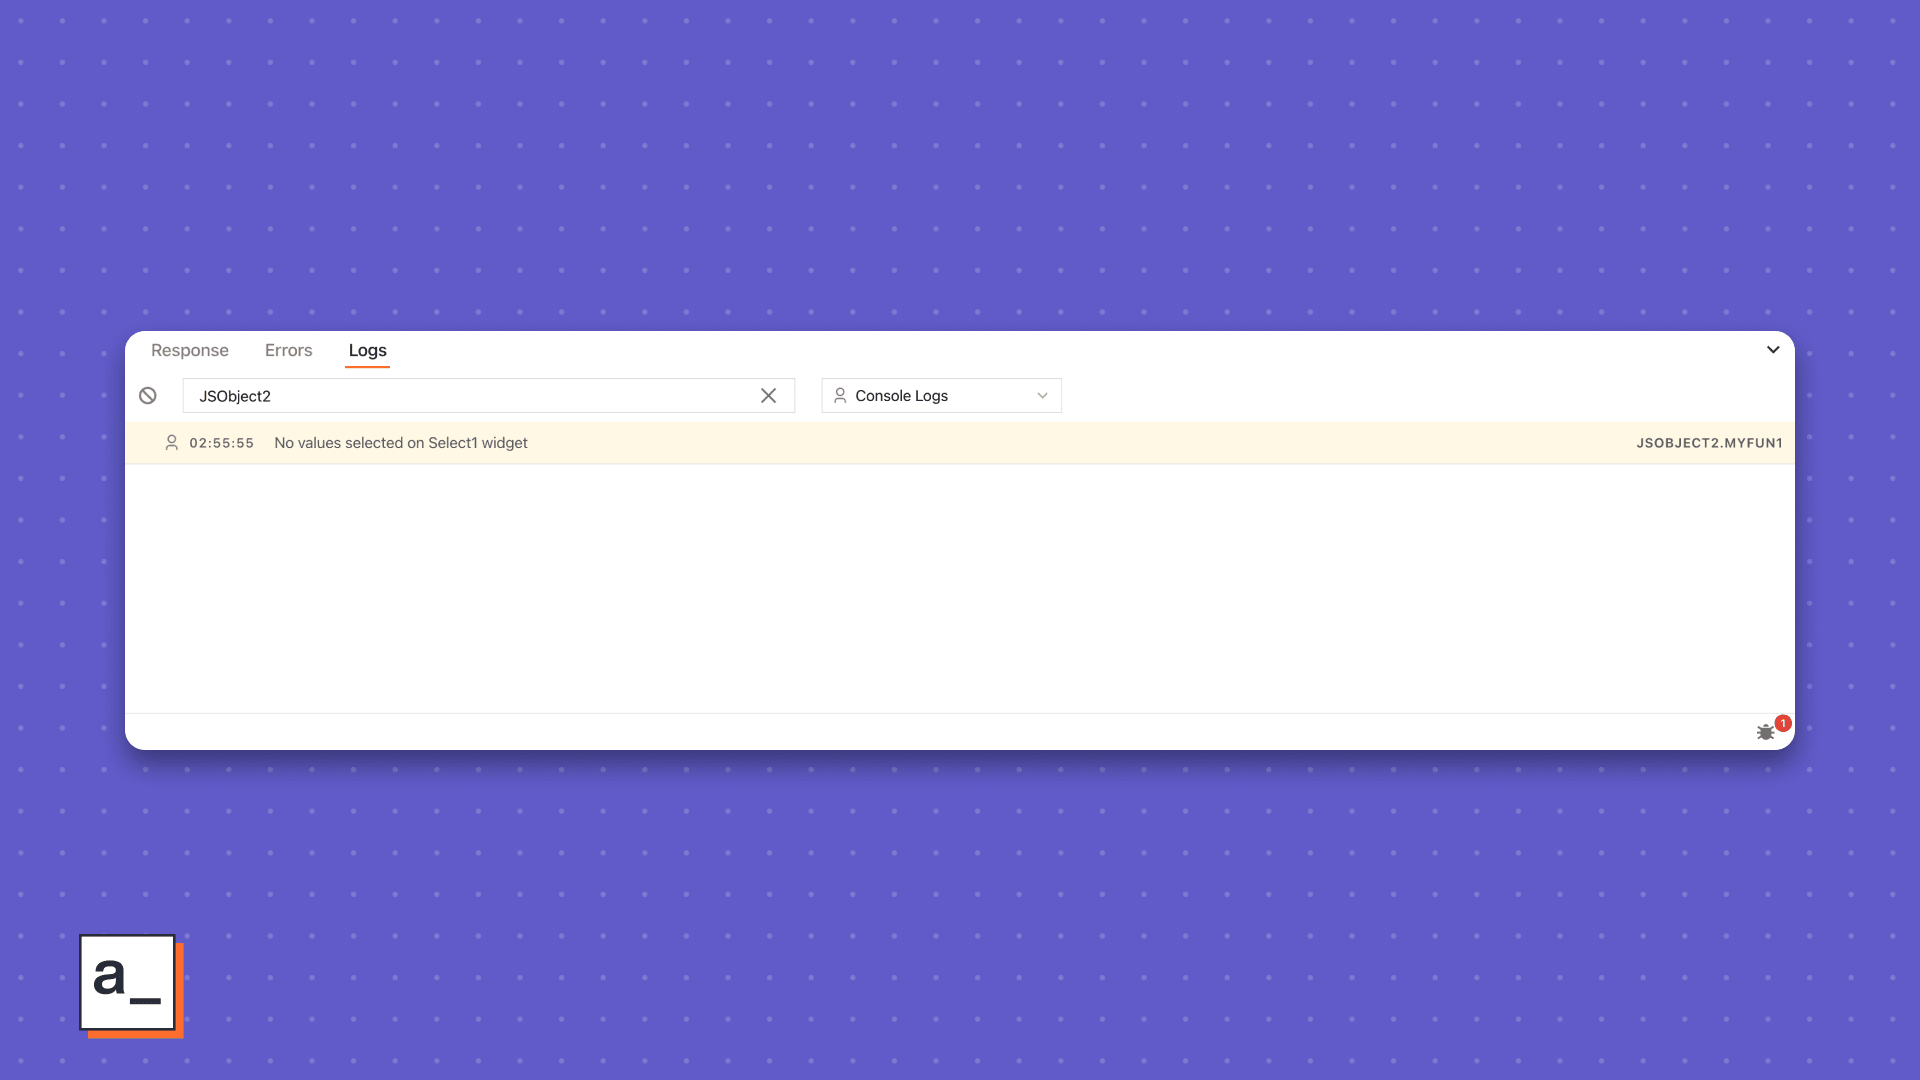
Jus as .error() aids error investigations, .warn() shows, well, warnings for known knowns. Some situations this can come in handy are,
When the evaluated value of binded data on a widget is not using the same datatype as the expected value
When widgets continue to use deprecated queries or functions
When the timezone used in a
datetimefunctions doesn't match the browser’s
Example
selectDefaultValue: () => {
    	 const defaultValue = Select1.selectedOptionValue;
    		if (defaultValue == ""){
    			console.warn("No values selected on Select1 widget ")
    		}
    		return defaultValue;
    },
Result
table
table (.) just does what it says—logs a Table widget’s data in key-value pairs for rows as objects. While we support this in Appsmith, we are still working on a browser console-like table, especially as we make the Table feature-richer.
Example
table1DataFunc: () =>{
		const data = Table1.tableData;
		console.table(data)
}
Result
That’s it! You now have the power of the console right within in Appsmith. Thank us later.
Related Blog Posts