Build a corporate KPI dashboard in minutes.
Ship a corporate KPI dashboard in minutes. Automate data collection, easily bring in data from multiple sources together, and visualize it in clicks with ready widgets to view key performance metrics, measure operational efficiency, track financial performance, and much more. Give your teams real-time insights to make informed, data-driven decisions and hit company targets.
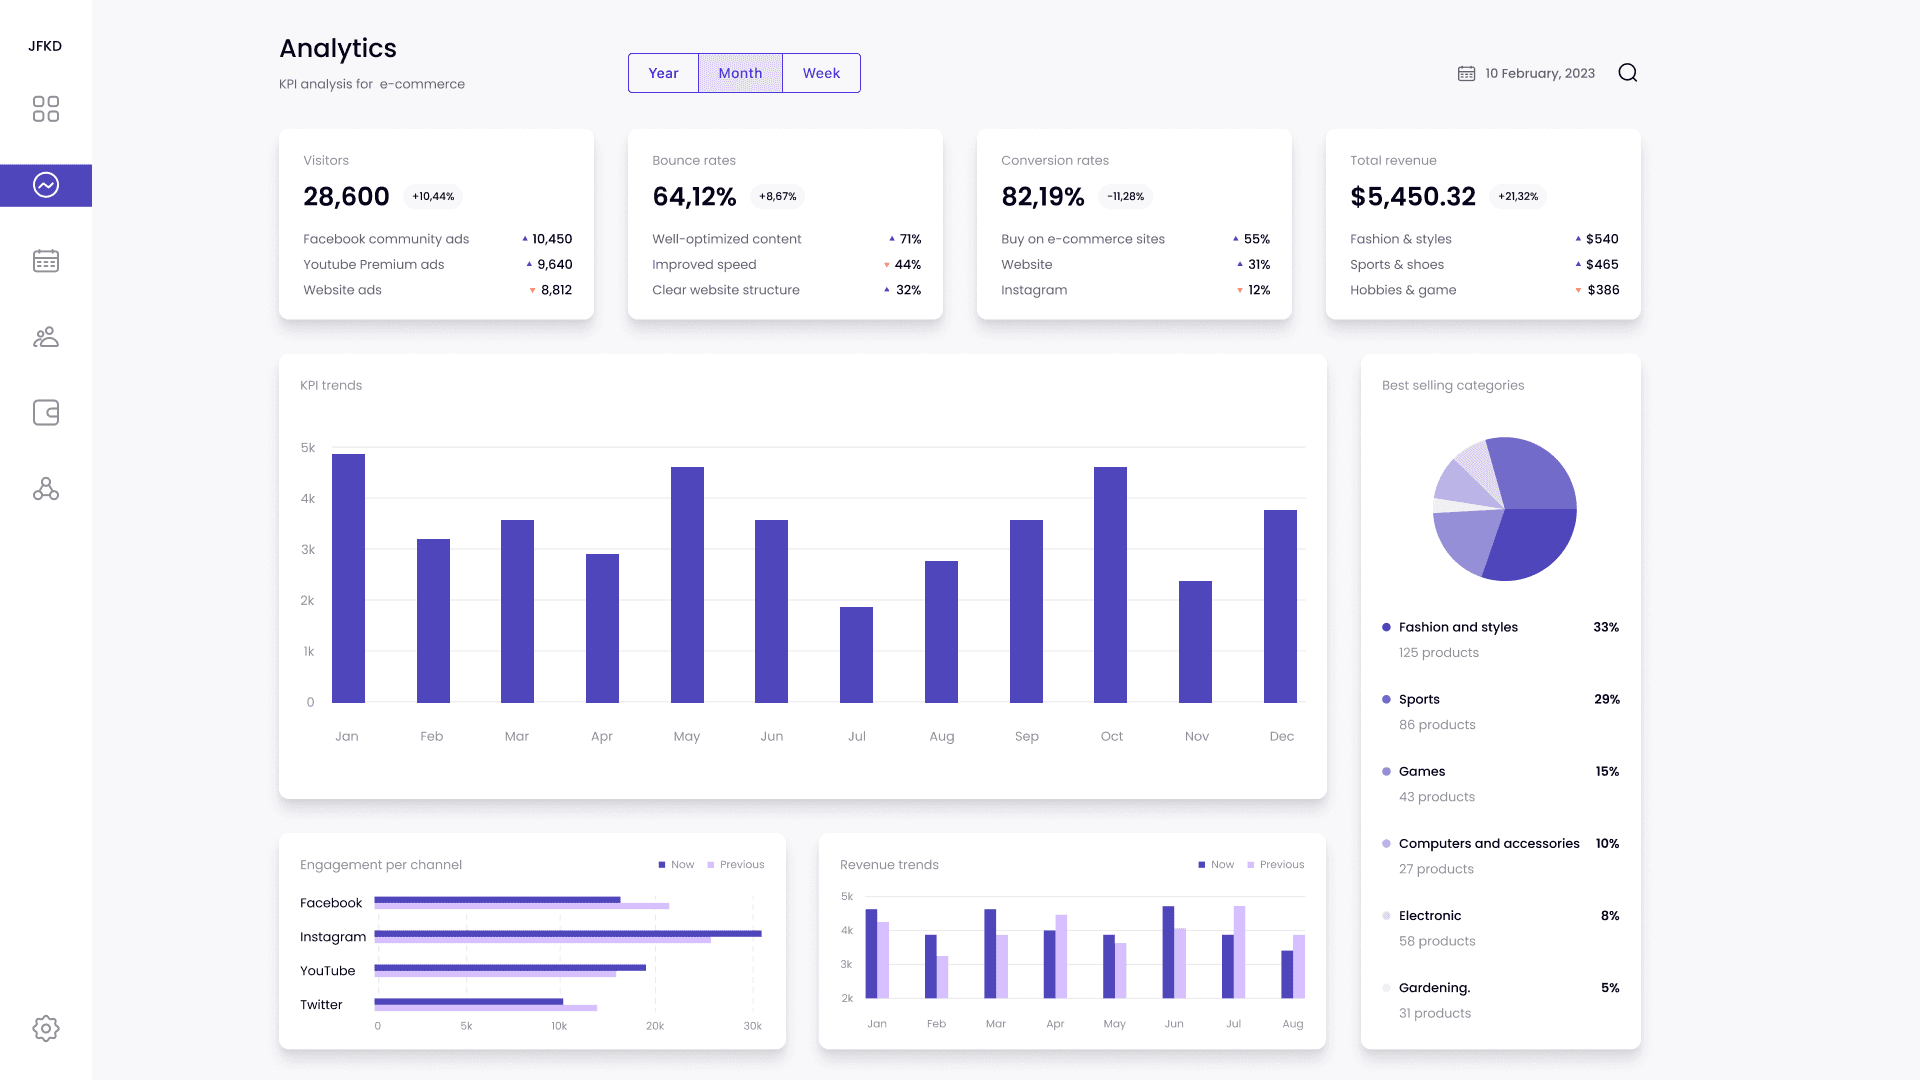
What is a corporate KPI dashboard?
A KPI (Key Performance Indicator) dashboard provides a quick, visual, and easy-to-understand overview of key metrics and data that is used to track and monitor the performance of a business, department, project, or individual against specific goals and targets.
What are the common features of a corporate KPI dashboard?
What are the common features of a corporate KPI dashboard?
A corporate KPI dashboard typically has the following features:
The ability to select and display relevant KPIs that align with an organization's goals and objectives.
Display of real-time data so that organizations can track performance and take action as needed.
Use of graphs, charts, and other interactive visualizations to present data in a clear and easy-to-understand format.
Integration with various data sources, such as spreadsheets, databases, and APIs, to provide a centralized view of key performance data.
The ability to customize reports and view performance data at various levels, such as by department, region, or company-wide.
Collaboration features that allow multiple stakeholders to view and interact with performance data in real time.
Measures to secure data, such as user access controls, to ensure the confidentiality and privacy of sensitive information.
Why build a corporate KPI dashboard instead of buying one?
Why build a corporate KPI dashboard instead of buying one?
A few common reasons companies build a custom corporate KPI dashboard include:
Every company has unique business goals, KPIs, and data sources. Building a custom KPI dashboard allows them to tailor it to their needs.
Custom KPI dashboards can be built to be flexible and adapt to changes in key metrics to be measured over time.
It is more cost-effective in the long run because most pre-built solutions charge for different integrations and have recurring feed making the costs add up quickly.
Building a custom KPI dashboard gives organizations complete control over their data and how it is used, which is important for ensuring data privacy and security.
What are the challenges of building a KPI dashboard?
What are the challenges of building a KPI dashboard?
Ensuring the quality and accuracy of the data used in the KPI dashboard is critical to making informed business decisions. Organizations must have processes in place to validate and clean data to minimize errors.
Integrating data from multiple sources into a single KPI dashboard can be challenging, as data may have different structures, formats, and update frequencies.
Getting stakeholders to use the KPI dashboard effectively requires ensuring that the dashboards are user-friendly and provide valuable insights.
Performance and scalability can be challenges, especially as the volume of data or datasources grows and the number of users accessing the dashboard increases.
Ensuring the security and privacy of sensitive data is a critical concern, especially when integrating data from multiple sources and sharing it with stakeholders.
Which teams use KPI dashboards the most?
Which teams use KPI dashboards the most?
All teams use KPI dashboards in an organization, but these are mostly used by the following teams:
Management teams
Human resources teams
Finance and accounting teams
Operations teams
Why Appsmith for a corporate KPI dashboard
Create dashboards in 30 minutes.
Use pre-built, configurable widgets such as charts (bar, line, pie charts, and more), tables, maps etc, to visualize your data as you want. With ready connectors to most popular datasources and a delightful IDE for queries, get your dashboard ready in minutes. Easily use our marketing portal template.
Bring in data from multiple datasources.
Connect to various datasources, including databases and APIs. Bind queries and JS Objects for different tables on one datasource or entirely different datasources to the same widgets as on your primary dashboard view.
Create stakeholder views and control access by role.
Customize stakeholder views on different pages of your app, make it interactive with drill-downs, and control access to data by role and groups.
What more can you do with Appsmith?
Build a backoffice control panel, a hiring metrics dashboard, a DevOps admin panel, or a bugs and issues tracker. Streamline your internal processes and improve company productivity by shipping business-critical internal apps quickly with Appsmith.
Manage and visualize data easily
Let users visualize and interact with all the data and metrics using interactive widgets, generate reports based on custom filters and date ranges, or review data trends in real time by geography, team, or project.
Bring data from multiple sources
Build one source of truth to track performance across teams by stitching together data from multiple datasources and SaaS tools. Add any custom functionality and controls you need using JavaScript.
Trigger custom alerts and actions
Set up alerts and notifications to team members or trigger custom actions to any third-party tool based on defined thresholds or when performance deviates from established goals and targets.
Which industries use KPI and similar dashboards the most?

Get live support from our team or ask and answer questions in our open-source community.
Watch video tutorials, live app-building demos, How Do I Do X, and get tips and tricks for your builds.
Discord
Videos
Do more with Appsmith
Ship a dashboard today.
We’re open-source, and you can self-host Appsmith or use our cloud version—both free.