Native GraphQL support, Console Logs, SOC2 certification, and more


In September, we went up a major version in preparation for the curtain raiser on two big features coming real soon—granular access controls and audit logs. We also made native GraphQL available in Appsmith, added a view for console methods, and shipped a whole raft of other improvements.
But before anything else…
We're SOC2 certified!
This certification demonstrates our long-held commitment to security as an integral part of Appsmith.
GraphQL + Appsmith = ❤️
Connect any GraphQL endpoint to Appsmith and use the familiar Query Editor to start working with your data.
With native GraphQL support in Appsmith, you can
↔️ see query objects and the variable dictionary side-by-side
✍️ write query and mutation objects in Appsmith
🧩 use fragments to save time with repeat code
📄 paginate your app easily with both limit-and-offset and by keyset, AKA cursor-based pagination.
Meet Console Logs
Also available now is a view for all console statements in your JavaScript. Called Console Logs under Logs in the Appsmith Debugger, it’s a much better way to see all the responses to your console statements than the browser sub-window.
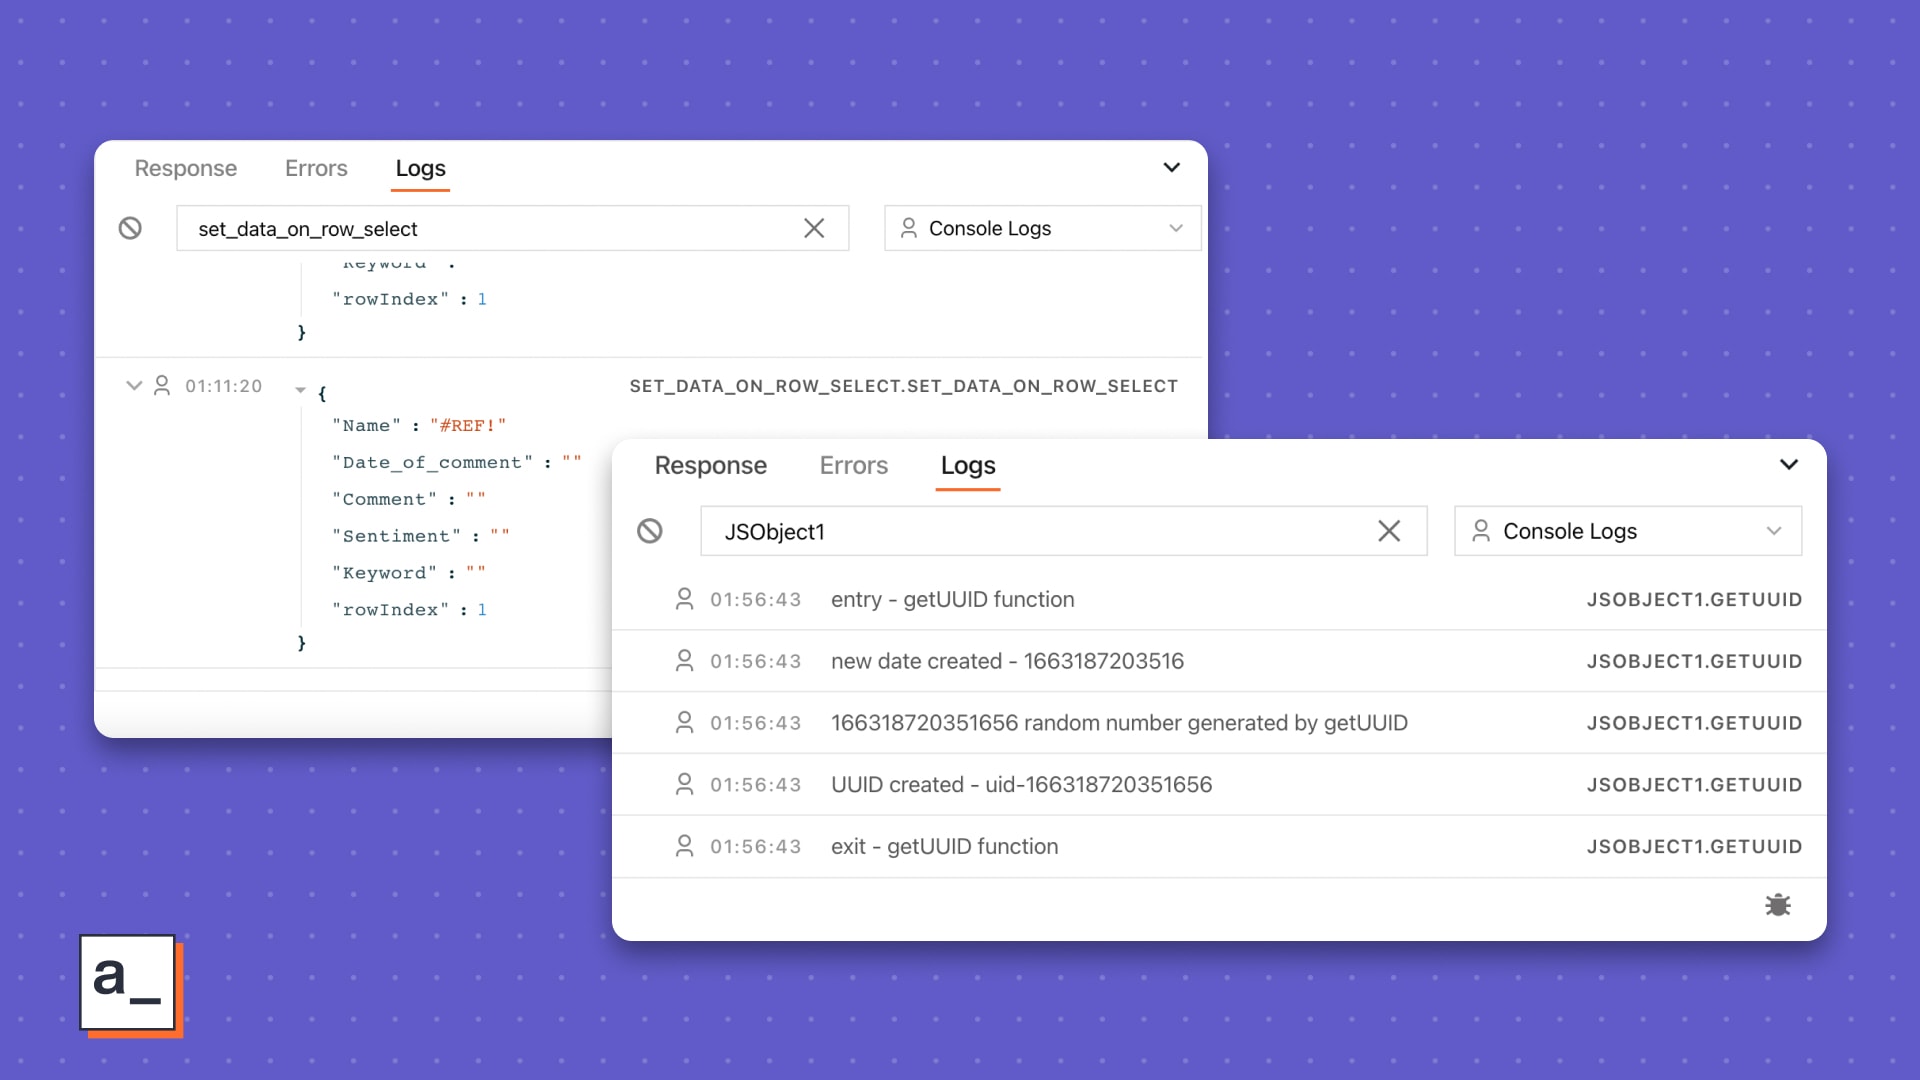
With support for console methods, you can
⛓️ log entry and exit points in your functions
🔢 specify a sequence of actions to log as they run
🛎️ fire helpful messages in your debugging flow
🤖 get auto-complete suggestions for all functions and variables when using console methods
⚡ write better code faster
Learn how to use console methods
Scanners + sliders
Code Scanner, a brand new widget to let your users scan codes from their device cameras for a variety of use cases—authentication, code redemption, even to just land on your app.
Learn more about supported types
Three visually engaging sliders are also here so you can let your end-users control numbers, a range, or the size of another component when they use your apps.
2X faster widgets
➗ We do smart math now to see which widgets you are changing and update only them on the canvas.
✖️ We also calculate space available on the canvas only when you are moving a widget on the canvas or when you are dragging a new one.
➕ Seemingly small changes? Nope. Render times have decreased from 250ms to 150ms in the Edit mode and 150ms to 80ms in View mode.
Tons of Table improvements
✅ The Table meets the Checkbox and the Switch in new column types.
🪜 The pageSize property on the table widget is now fluid based on the the table’s height.
🚣 Row properties on the Table now ignore interactive column types like a Button or an Icon.
The debugger gets a facelift
🎢 Repeat logs now get grouped into one log line that you can click and expand.
🔥 Performance boost: Instead of saving each log line by line, console methods now save a batch of logs together
What’s the Debugger? Check out our teardown.
More details and a bunch more features, improvements, and fixes at our GitHub.👇
Related Blog Posts