E-commerce Order Management Dashboard with Hasura and GraphQL


GraphQL is a query language for APIs and a server-side runtime for executing queries using the system you define for your data. It provides a complete and understandable description of the data in your API, gives clients the power to ask for exactly what they need and nothing more, makes it easier to evolve APIs over time, and enables powerful developer tools.
Today, developers spend a lot of time building internal applications, dashboards, and admin panels with GraphQL APIs as backend. But guess what? It’s now possible for you to write customizable applications with the ability to quickly prototype and deploy in a few minutes. With Appsmith, a low code app builder, you can build entirely customizable internal tools without spending too much time or effort.
In this blog, I am going to be building an e-commerce order management tracker or dashboard.
To build this app, we will connect Appsmith with a GraphQL API and build an interface that will fetch information from a database. We will use Hasura to create, manage, and customize GraphQL APIs.
“”Hasura is an open-source service that gives you production-grade GraphQL & REST APIs on your data instantly. It allows you to develop and deploy GraphQL APIs in minutes. At the core, Hasura helps you build APIs with a simple to use GraphQL composer and a GraphQL server that is stateless and blazing fast.
What exactly are we building?
By the end of the tutorial, we will have a fully customizable e-commerce order management dashboard! Typically, such dashboards enable the app users to:
Manage the entire product catalogue
View sales, track all details of total and recent orders
Send email to customers
Note: We will be using data from Hasura Super App, which can be found here. You can directly migrate the data here to your Hasura instance in just a few steps listed here: Moving from local development to staging and going production with Hasura.
Alternatively, you can connect to the instance we created for you to test and play with GraphQL APIs on Appsmith. These details of the instance are disclosed in the next section :)
All right, let's dive in!
Connect to Hasura on Appsmith with GraphQL
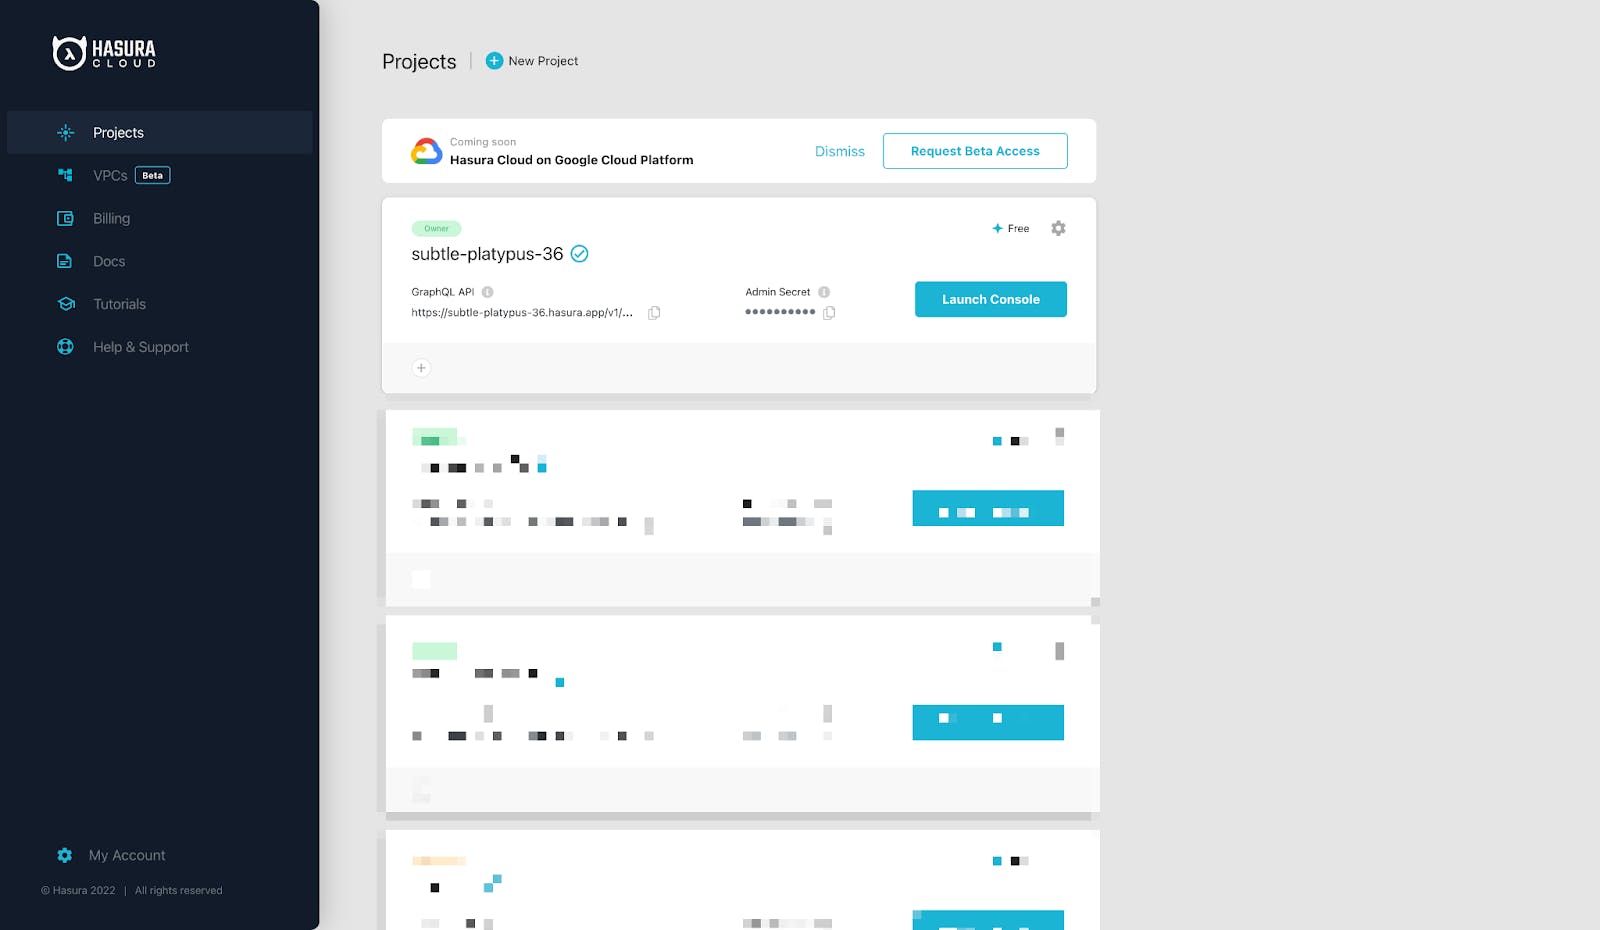
We will be connecting to the Hasura instance via the REST API datasource on Appsmith. For this, we will need the GraphQL API end-point and Admin Secret key from Hasura Dashboard. If you're using your instance, this is how your dashboard looks like, where you can copy the mentioned details.
“”If you want to know more about the data schema and customize the relations between tables, you can always use Hasura cloud explorer.
Now, let's quickly take a look at all the tables that are available on Hasura Super App Dashboard in brief:
user: This table contains a list of all the customers who signed up for the Hasura super app.
address: The address tables contain all the user delivery addresses that will be further linked to the order.
admin: Details of all the super-admin who have access to all the dashboards
order: The order table contains all the order information a user places
order_product: This table contains a list of products that are included in the order
order_status: Contains details of order delivery status
product: Details of all the products on the e-commerce store
product_review: Reviews of products that the customers gave
Awesome, now that we had a glance at our tables, let's build the app! First up, we'll need an account on Appsmith Cloud. You can create it here for free if you don't have one. After we log in, we will be redirected to our dashboard to make a new Appsmith; this can be under any organization of your choice.
Now, to connect Hasura APIs, follow the below steps:
Click on the + icon next to datasources and choose Create new API under the Create New tab.
Rename the query to getProducts by double-clicking on the existing one.
Set the query type to POST, and paste the following URL:
https://subtle-platypus-36.hasura.app/v1/graphql
Under the headers pane, add the following key-values:
content-type: application/jso
x-hasura-admin-secret:
Lastly, navigate to the Body property under the API pane, set the body type to JSON, and paste the following:
{{
JSON.stringify({
    variables: null,
    query:
    query {
        product(limit: 300) {
            id
            brand
            category_display_name
            created_at
            description
            name
            image_urls
        }
}
})
}}
Now, we can test this GraphQL query by clicking on the RUN button to the top-right of the application; with this, we should see all the products list from the backend in the response body.
Following is the screenshot:
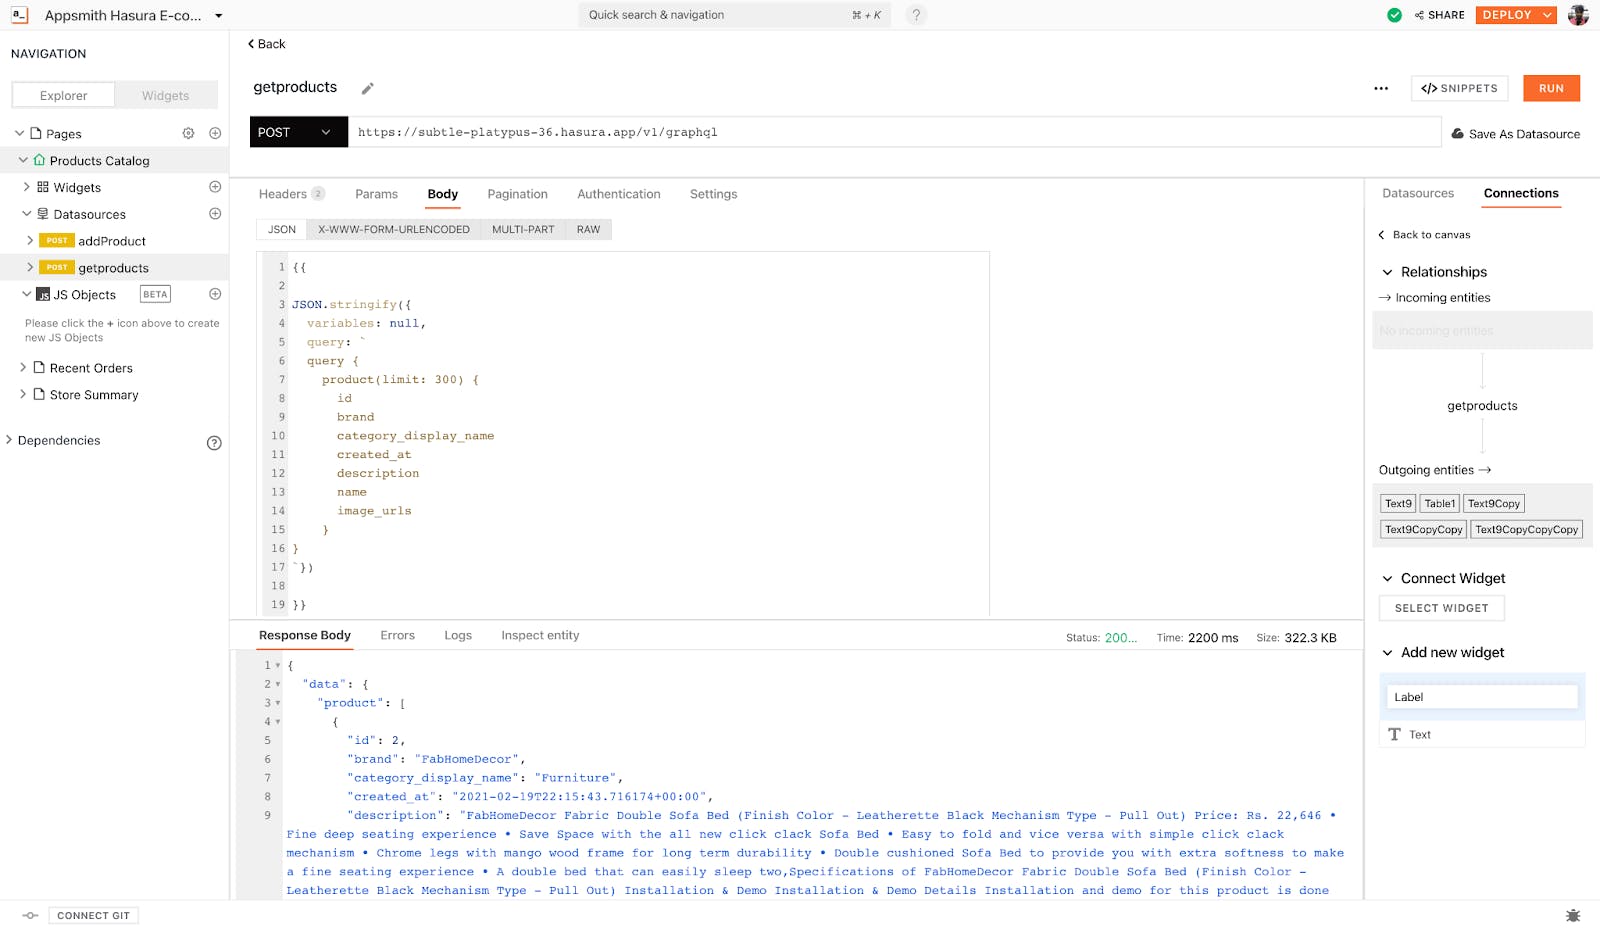
Here, inside the body pane, we write the GraphQL query to fetch all the products; this is similar to how we do it on a regular GraphiQL playground.
Now let's bind this data onto the table widget.
For this, click on the + icon next to widgets and drag and drop a table widget onto the canvas.
Select the table on the canvas; this will open the property pane on the right sidebar; now, under table data, we bind the query using the moustache syntax:
{{ getproducts.data.data.product }}
And just like that, we should see all the data from the query binded onto the table.
Note that all the columns are not required for us. Hence, we can hide them by clicking on the eye-icon on the column name under the columns property.
Adding a New Product to Database
Doing a simple READ operation using Hasura's GraphQL API is easy now; let's look at how we can do a WRITE operation by building a form on Appsmith. Follow the below steps:
First, let's drag and drop a new button widget on the canvas; the idea is to open a modal and show a form to create a new product on the e-com store.
Next, add a text widget and a few form widgets on the modal by dragging and dropping them onto the modal from the widgets section.
We can also set the form's label by updating the label property from the form's property pane.
Following is a screenshot of how the form should look like:
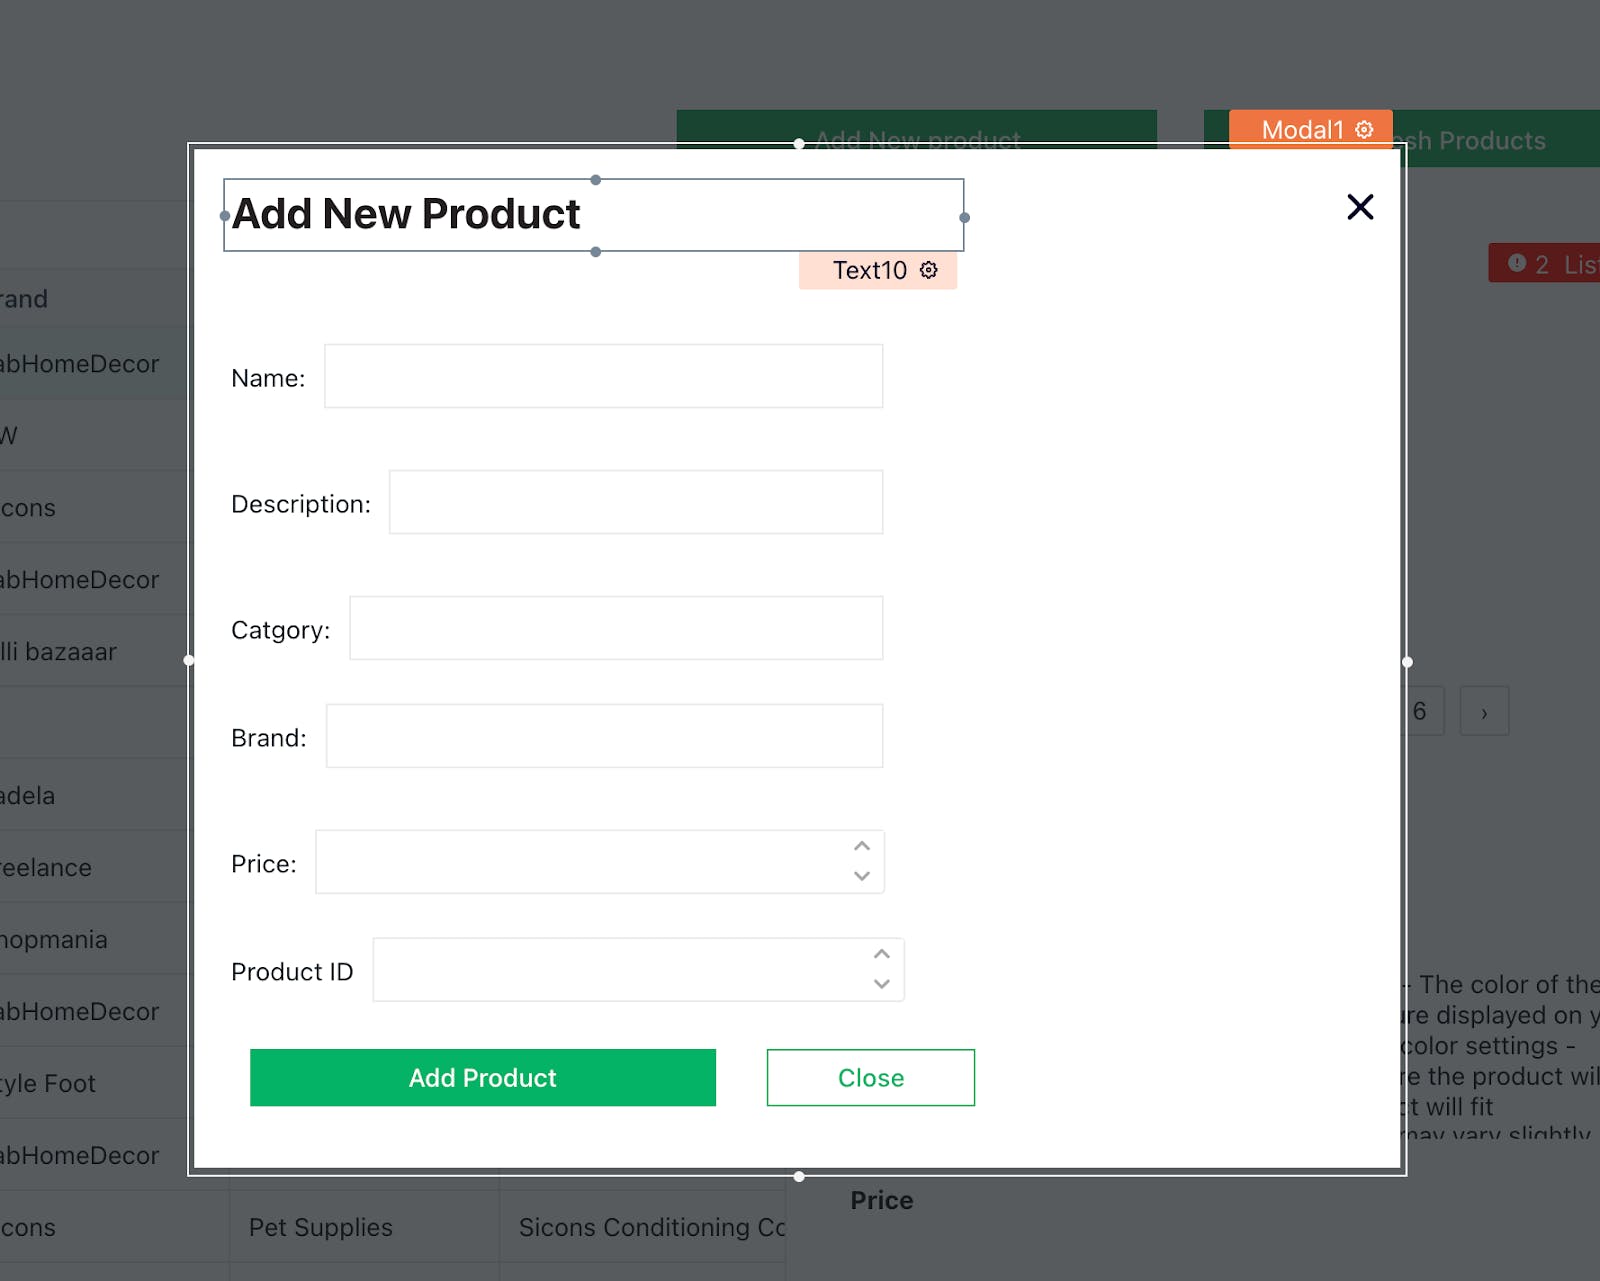
Now, update the form names to the following to access them in the query:
“”You can update the widget names from the property pane by double-clicking on the existing one.
Name: getName
Description: getDescription
Category: getCategory
Brand: getBrand
Price: getPrice
ProductID: getID
Now, add a new button, update its label to Add Product, and set its onClick property to "Run a query" and choose Create a new API. This will create a new API datasource under the datasources section. Now, follow the below steps to create a new query that lets us post new data onto PostgresDB on Hasura.
Rename the query to addProduct
Update the URL to:
https://subtle-platypus-36.hasura.app/v1/graphql
Set the method type to POST, and copy the headers x-hasura-admin-secret, content-type from getProducts query to here.
Update the query body to the following:
{
    "query": {{JSON.stringify(
    mutation ($object: insert_product_insert_input!) {
        insert_product_one(object: $object) {
    id
            brand
            category_display_name
            description
            price
            name
        }
    }
    )}},
    "variables": {
        "object": {{
          JSON.stringify({
    id: getID.text,
            brand: getBrand.text,
            category_display_name: getCategory.text,
            description: getDescription.text,
            price: getPrice.text,
            name: getName.text,
        })}}
    }
}
Here, we have an object consisting of a query key that holds the GraphQL query and a variables key with all the variables that need to be posted to the database.
In the query, we have a mutation that lets us modify the server-side data. We'll send the object that references the data querying inside the mutation. The insert_product_one allows us to post one object to the database. Inside this query, we can add the attributes we need to post. Next, we've associated the variables to the object from the created UI input widgets. The .text on the input widget name helps us get the text written inside the input.
That's all, and our query is now ready! We can test this out by opening the form and creating a new product on our e-commerce store.
Add Stats on Dashboard
In this section, we will be showing some statistics on our dashboard; for this, let's drag and drop three stat box widgets onto the canvas. Following is a screenshot of how it looks like:
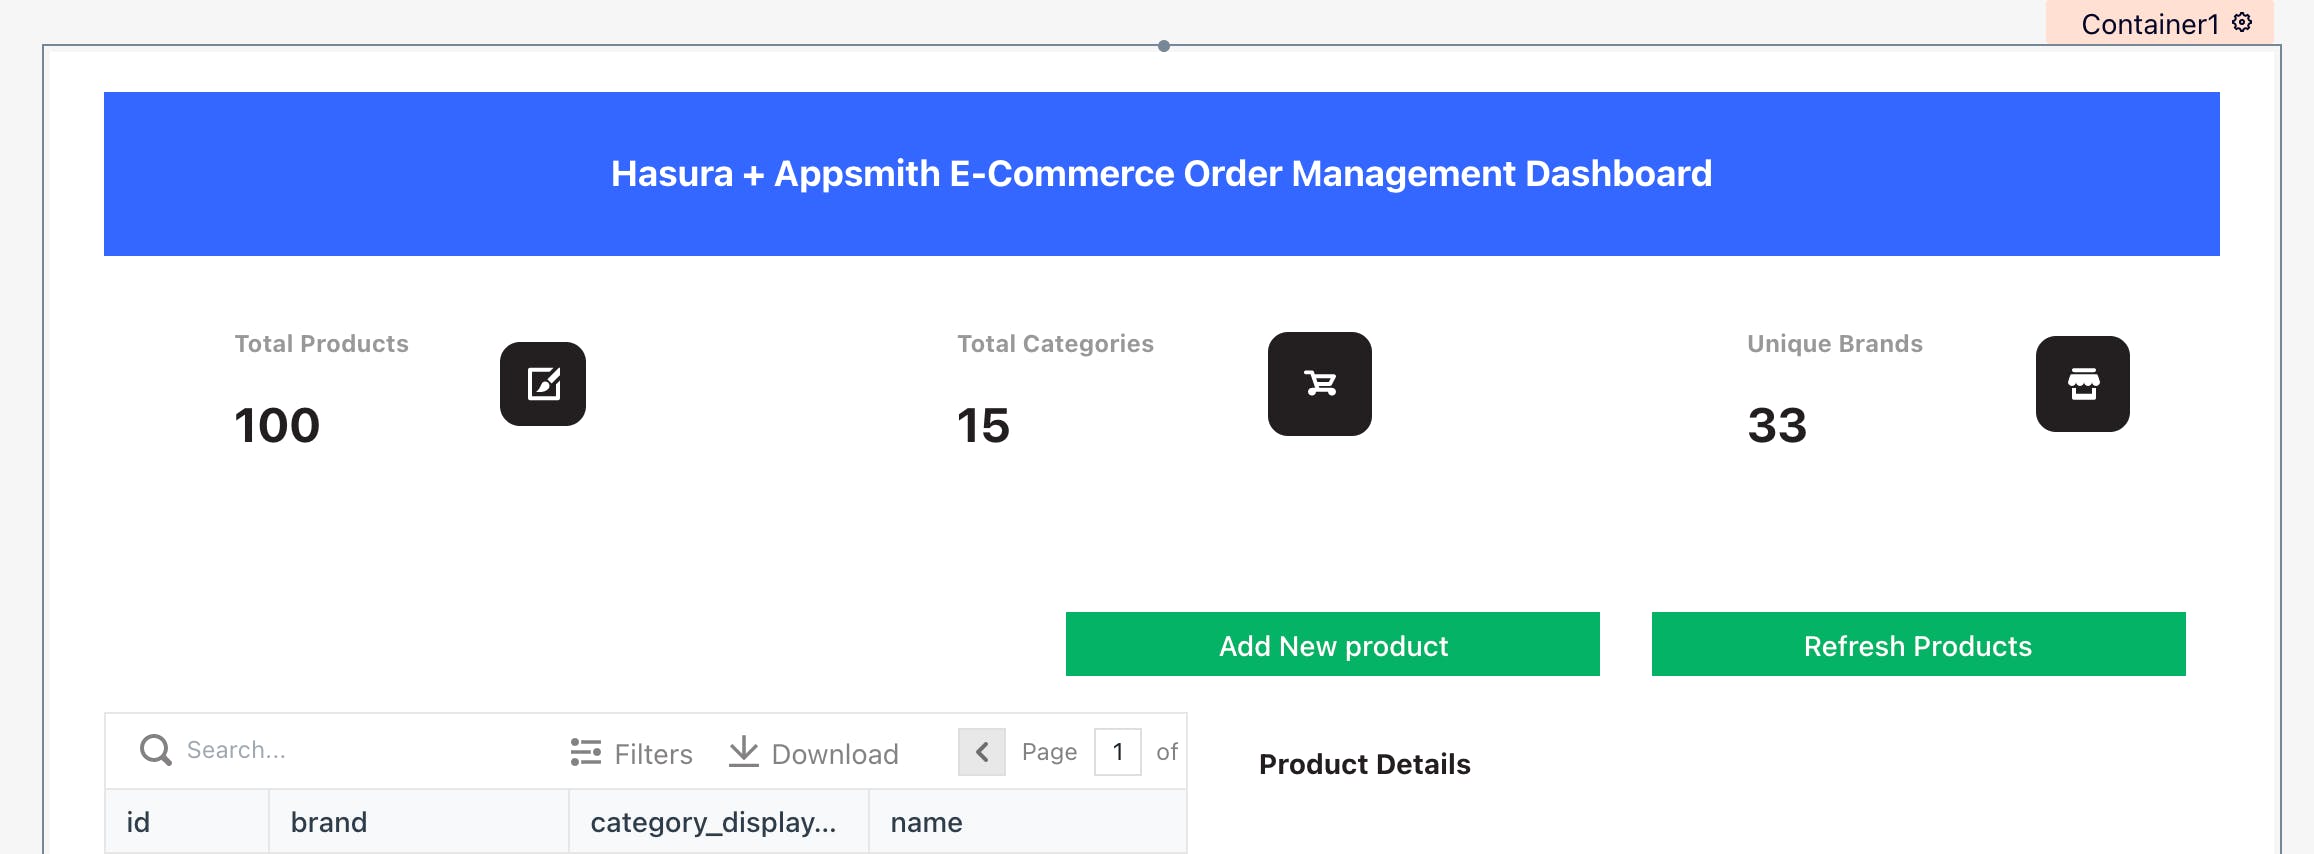
As we can see, these stat box widgets compute the total products, total categories, and unique brands. The data here is computed directly from the Hasura instance, using JavaScript. Following is how it works:
On the first stat box widget, select the text-widget and paste the following in the Text property:
{{getproducts.data.data.product.length}}This small JS code will return the array's length from the getproducts query, displaying the total products.
Similarly, update the other two stat box widgets with the following JS code:
To compute Total Categories, we use an IIFE function and filter the getproducts query using its category_display_name attribute :
{{
function(){
    const filterProducts = getproducts.data.data.product.map(item => item.category_display_name)
  .filter((value, index, self) => self.indexOf(value) === index)
    return filterProducts.length
}()
}}
To compute Unique Brands, we use an IIFE function and filter the getproducts query using its brand attribute :
{{
function(){
    const filterProducts = getproducts.data.data.product.map(item => item.brand)
  .filter((value, index, self) => self.indexOf(value) === index)
    return filterProducts.length
}()
}}
There we go; we now have our dashboard up and running! Not just that, Appsmith allows us to create charts on top of Hasura data. Let's learn more about it in the next section.
Charting on Appsmith on Hasura Data
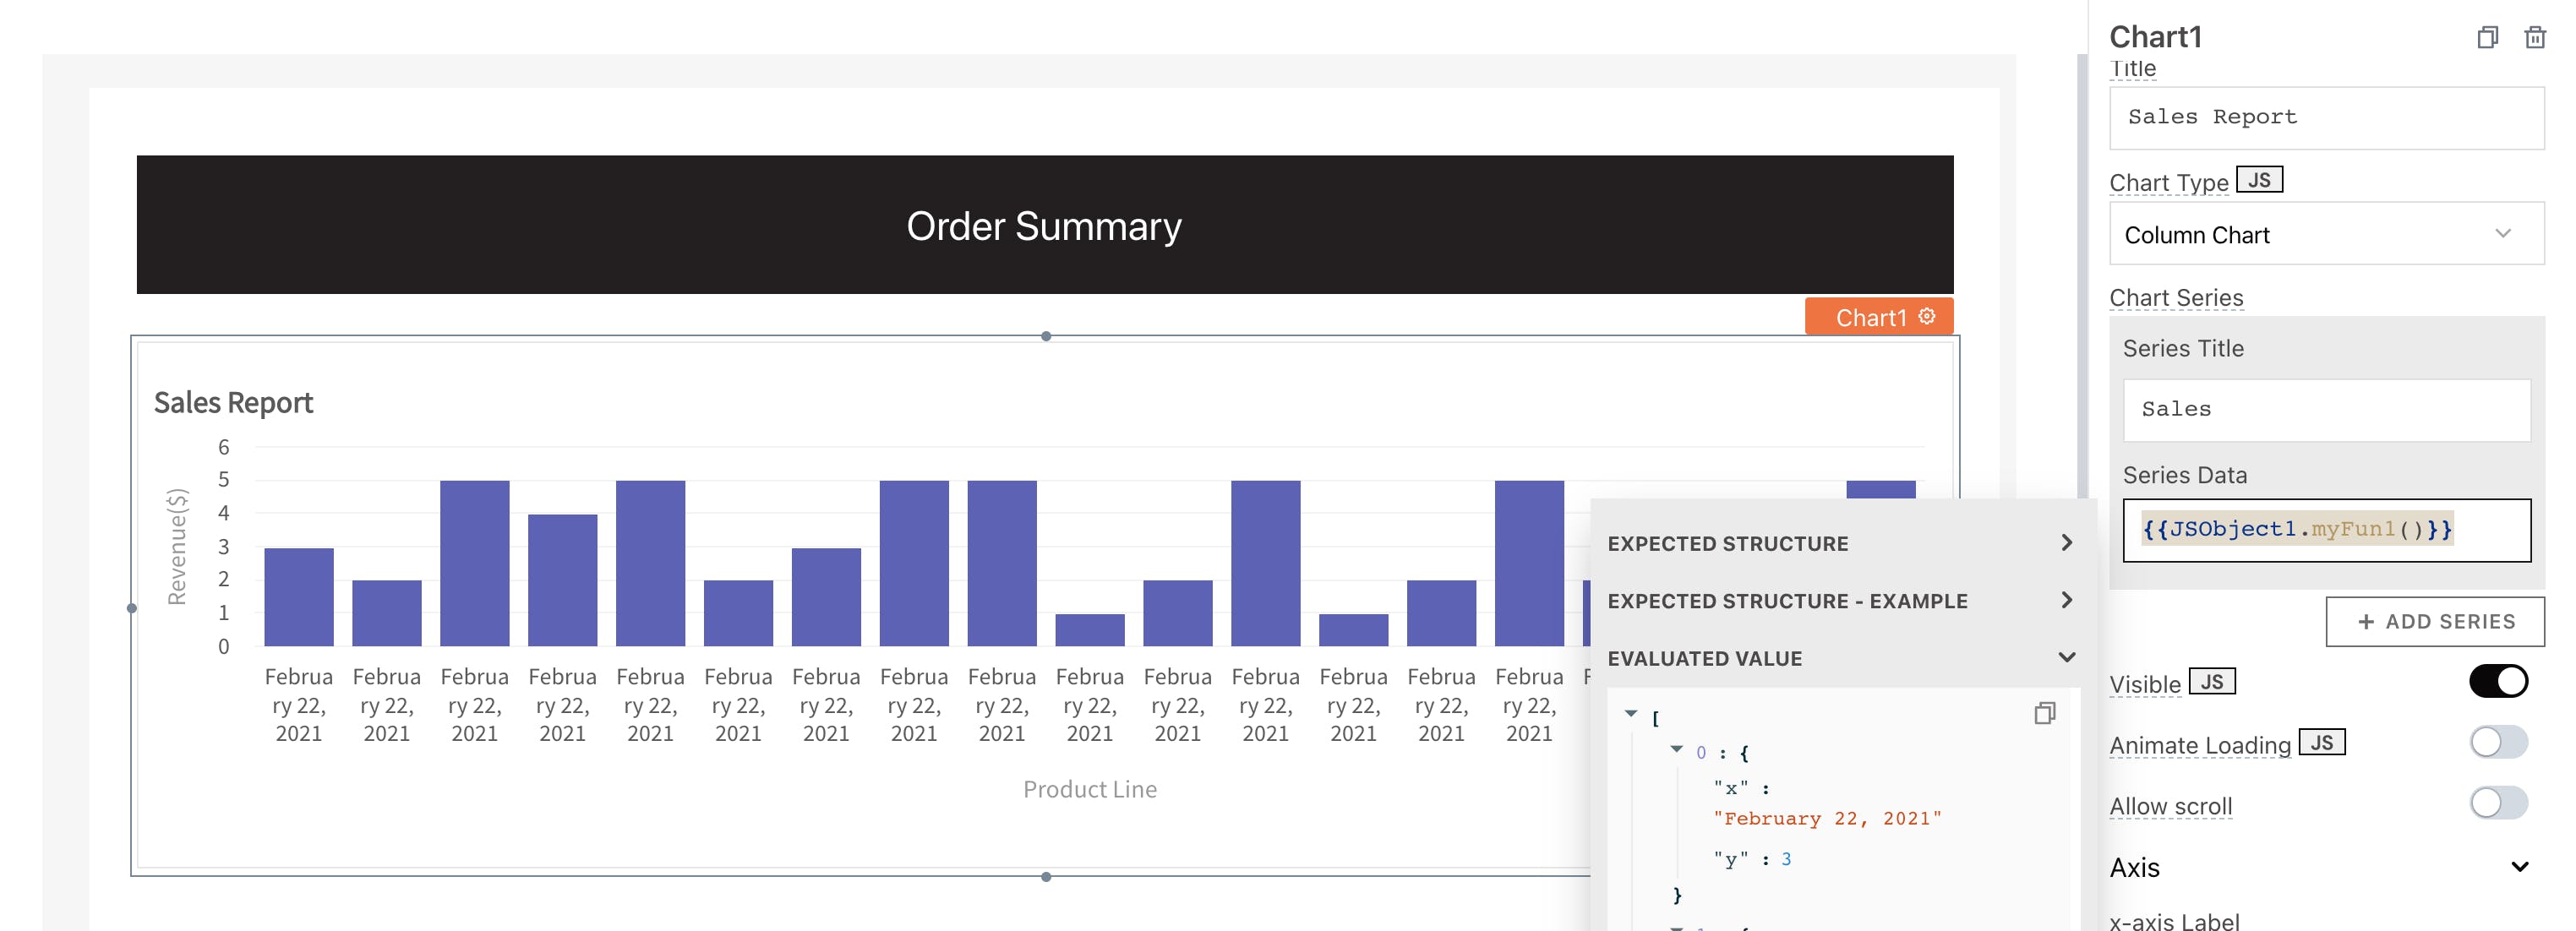
To get started, let's rename the page as Recent Orders; the idea is to create a chart that shows daily sales. Drag and drop a new chart widget onto the page from the widgets section.
This will show you a column chart with some pre-defined data; let's update this by creating our new query that fetches all the sales data:
Click on the + icon next to datasources and choose Create a new API.
Set the query type to POST, and update the URL to
[https://subtle-platypus-36.hasura.app/v1/graphql](https://subtle-platypus-36.hasura.app/v1/graphql)
Under the headers pane, add the following key-values:
content-type: application/json
x-hasura-admin-secret: YOUR_SECRET_KEY
Lastly, navigate to the Body property under the API pane, set the body type to JSON, and paste the following:
This query will return a bit complex JSON; we will see something like:
{ "data": { "order": [ { "order_products": [ { "product": { "order_products": [ { "quantity": 2 } ] }, "created_at": "2021-02-22T18:16:17.776779+00:00" } ] }, … }
Here, order_products are nested in an array; hence, to process this and put it on a chart widget, we create a new JS object, allowing us to write full code on Appsmith and utilize its widgets. Confused? Follow the below steps:
Click on the + icon next to JS Objects, or use the JSObject1
Update myFunc1 to the following:
myFun1: () => {

  const data = _.compact(salesGraph.data.data.order.map((row) =>
  {
        const quantity = _.get(row, 'order_products[0].product.order_products[0].quantity');
        const created_at = moment(_.get(row, 'order_products[0].created_at')).format("LL");

        //if any of those inundefinedif (!quantity || !created_at) returnundefined;

        return {
      x: created_at,
             y: quantity,
    }
  }))
    return data.slice(1, 20)
    },
Here, we do a simple ordering using the _.compact method from lodash to aggregate the total number of sales done on a particular date. We return these in a special {x: value, y: value} format, which is accepted by the chart widget.
Now, let's head back to the chart widget and use this JS Object:
Update the series data property with the following:
{{JSObject1.myFun1()}}
Boom! There you go, we have all our sales aggregated based on the date on a beautiful chart widget. Following is how it looks like:
We also extended this app to show all the sales and orders on stat boxes and list widgets. Here's the link to the complete application! Also check how you can build an order processing tracker for your eCommerce store.
If you liked this tutorial, and are planning to build this, let me know. I’d love to help you make it as complex as you’d like.
Write to me at vihar@appsmith.com.