How to build a GitHub issues dashboard in thirty minutes or less
GitHub Insights provides totals on issues and pull requests including links to individual issues and PRs. You can filter by the last day, three days, a week or a month. It’s like a dashboard overview of your GitHub repository.
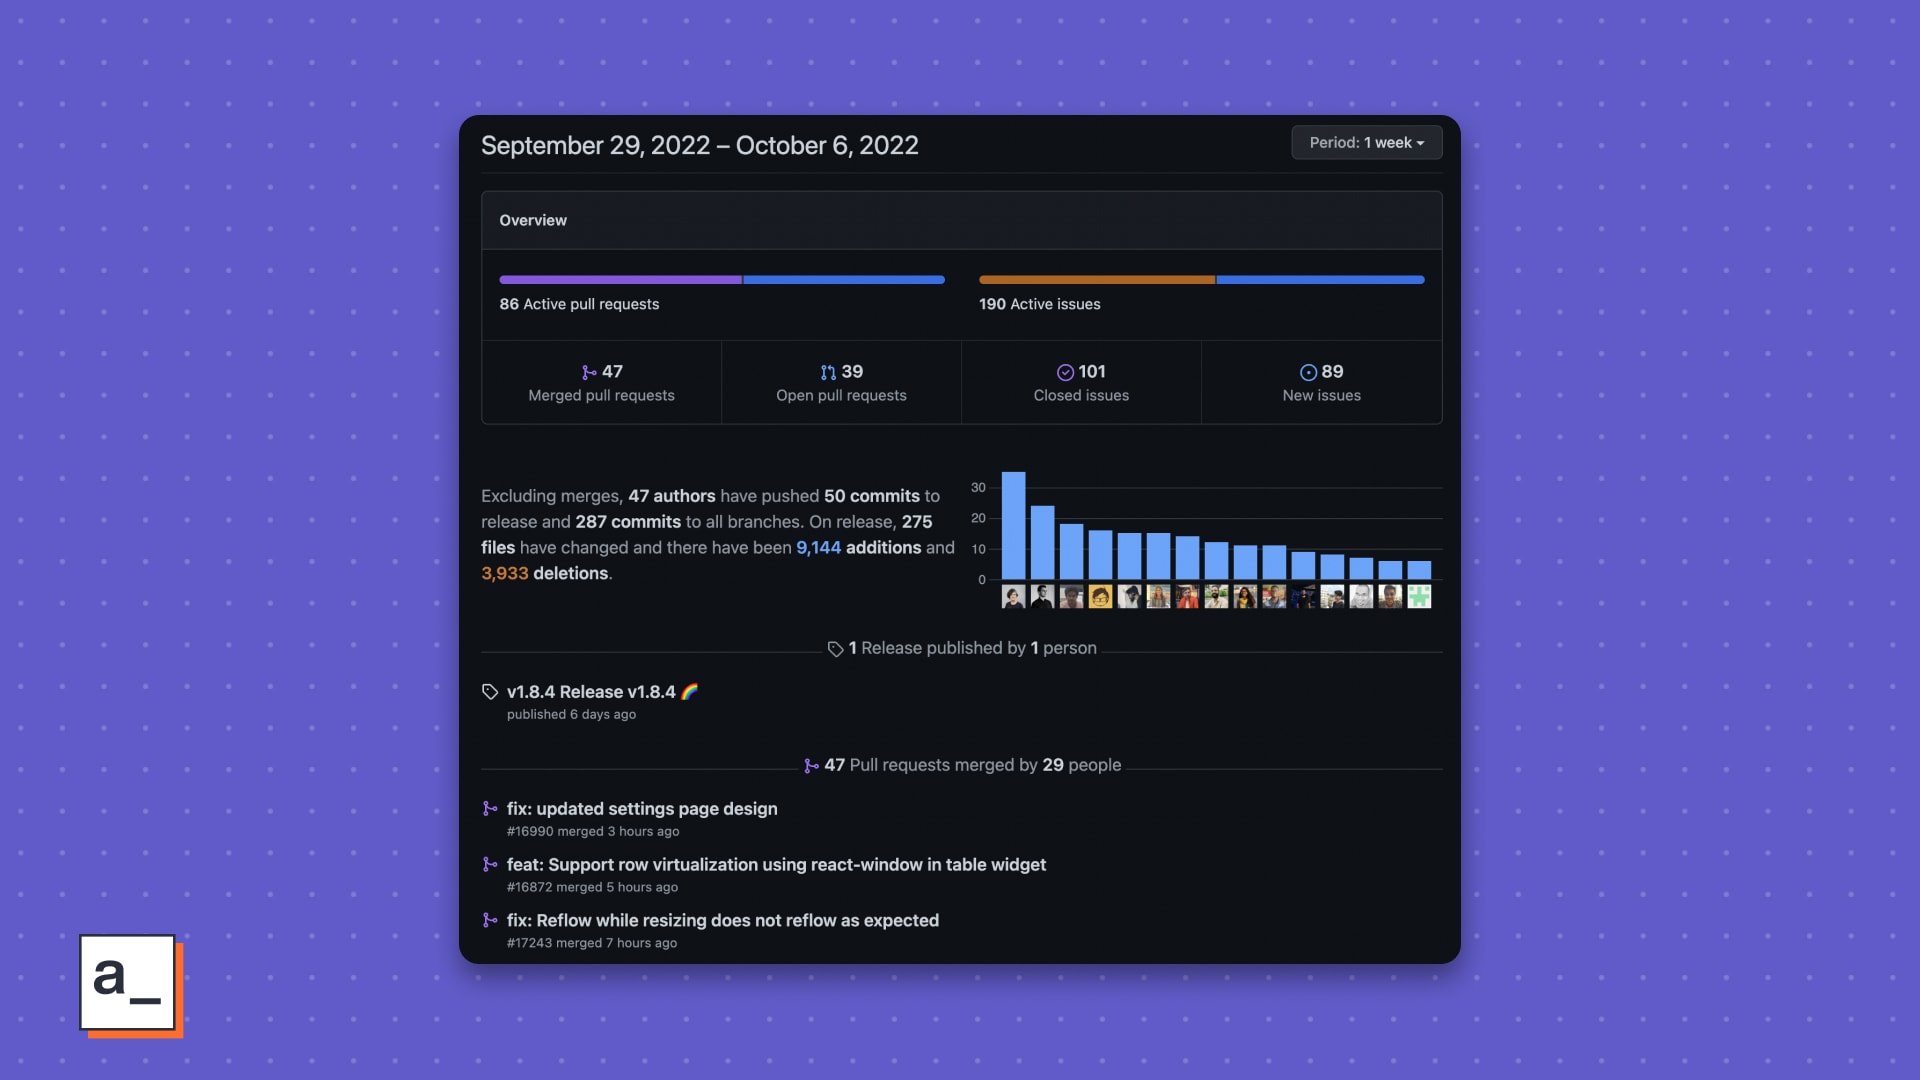
While this is useful, it lacks a few key features.
It can’t have customized views for insights unique to you and your team.
It doesn’t drill-down into sub-categories of like issues by type or most popular issues by the number of comments.
To get around, this two-part post will show how to build a custom dashboard for your team and repos using GitHub’s GraphQL endpoints and native-GraphQL support in Appsmith.
Sign up to build your own GitHub insights dashboard
What this part covers
In two words, GraphQL and JavaScript. You will see how to:
Enable GitHub’s GraphQL API for your repo and create an access token
Build queries with the GitHub GraphQL explorer
Use GraphQL query variables
Use the authenticated GraphQL API in Appsmith
Present the response data on a dashboard
Use the Array map() method in JavaScript
Use Object.keys() to get an array of the field names
Use the Reduce method to make a pivot table
Use the ternary operator to conditionally flatten nested data
Enabling the GitHub API
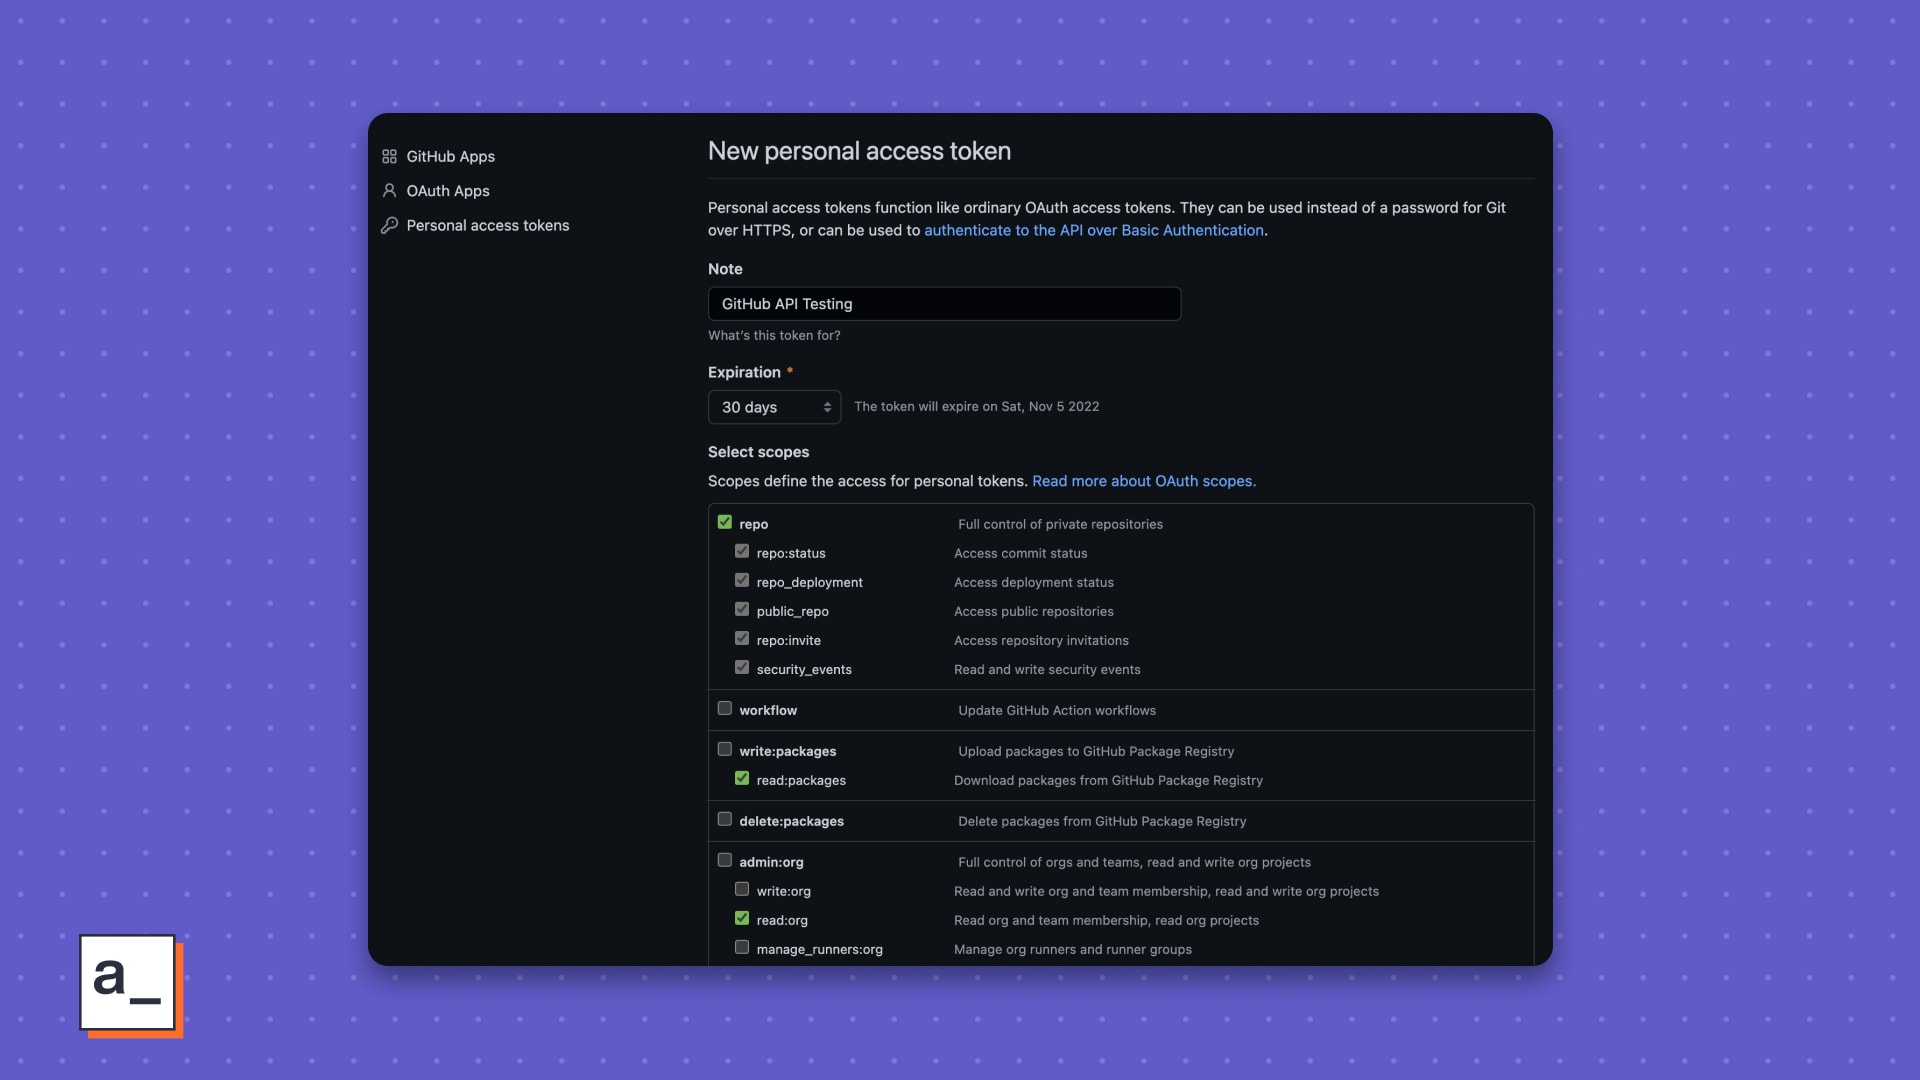
From your GitHub apps settings,
Select Personal Access Token, and then Generate a new token.
Add a note, set an expiration date, and select the scopes you want to enable. For our dashboard, we’ve left all the write scopes unchecked because the dashboard is read-only.
Click Generate Token and then copy and save the token somewhere safe. You won’t be able to access it again from GitHub.
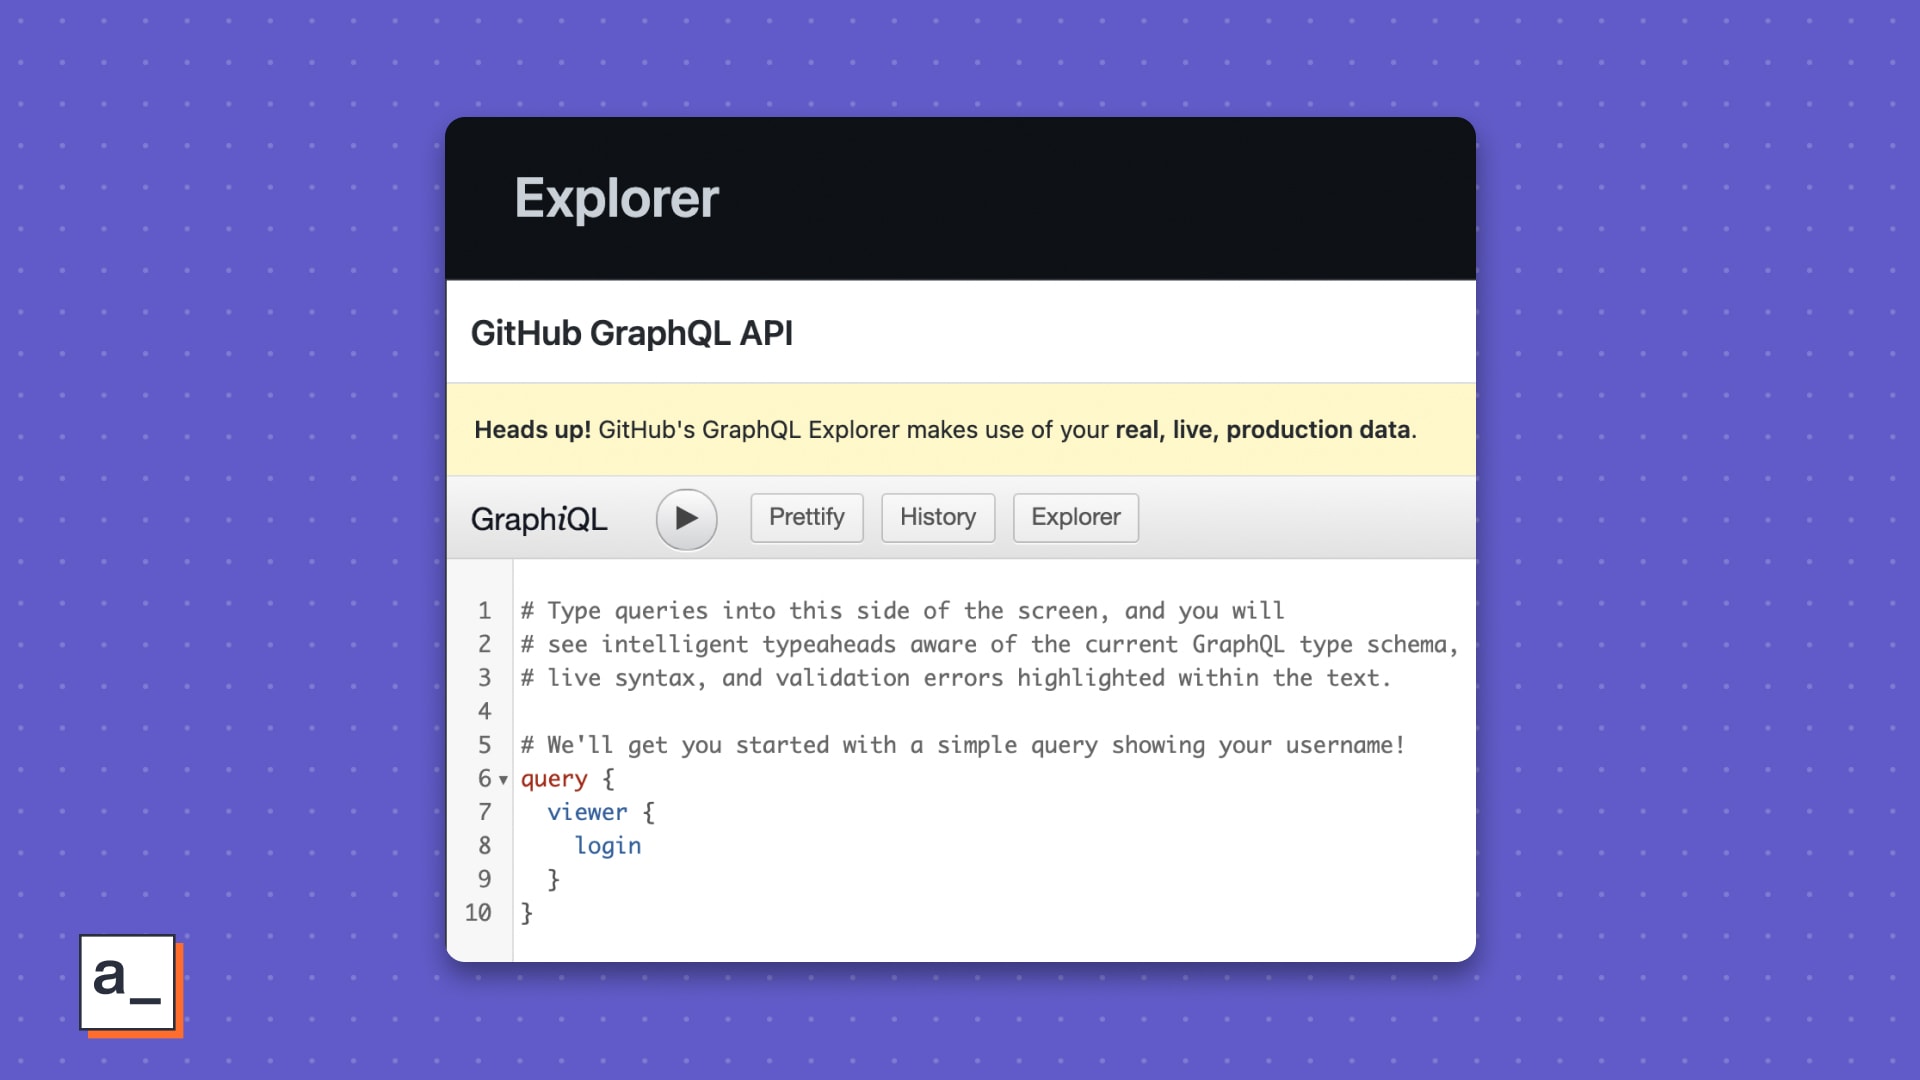
Building queries with the GitHub GraphQL explorer
Start by logging into the Explorer to access the GraphQL API. You should see a default query already entered. Run it to make sure the Explorer can access your GitHub account.
{
  "data": {
    "viewer": {
      "login": "YOUR_GITHUB_LOGIN"
    }
  }
}
You should get back a response with your GitHub username.
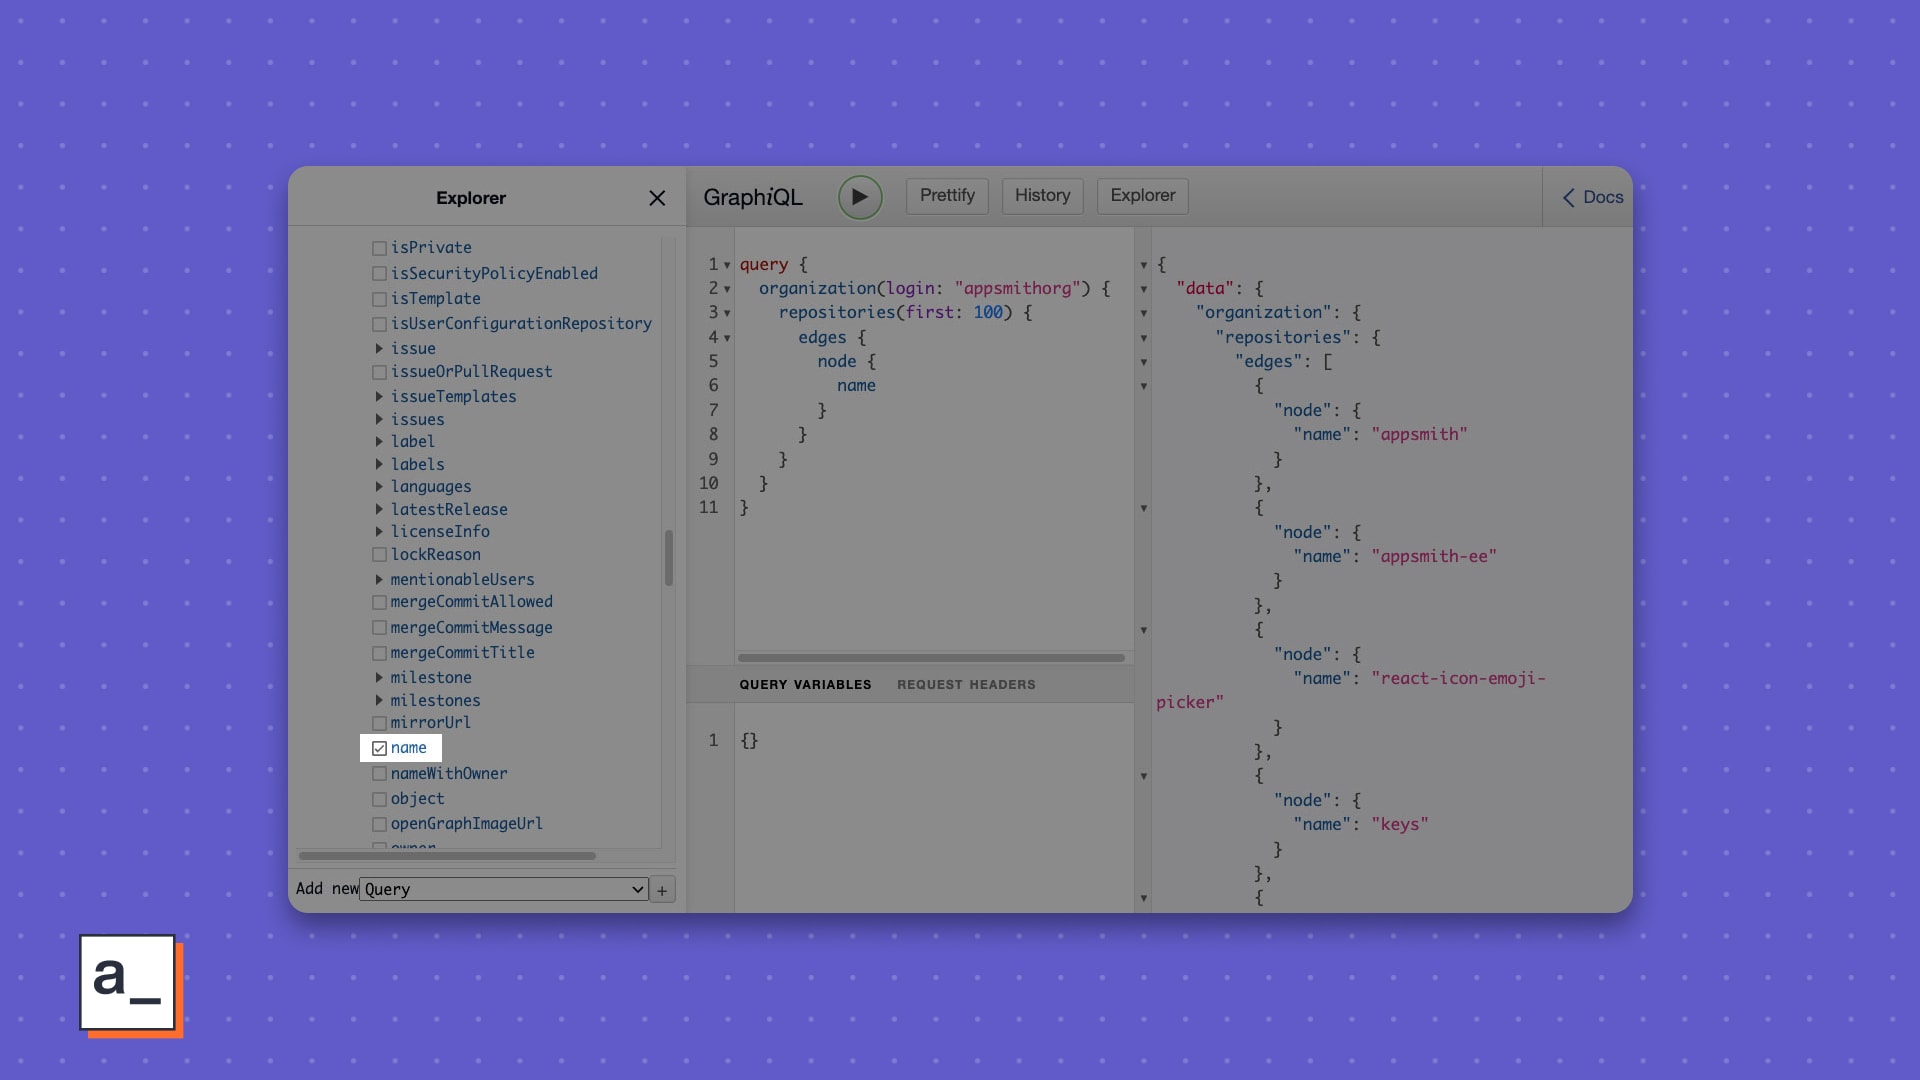
Click the Explorer button next to show the left sidebar, then build a new query to get a few top level stats about your repo. Just go through the >repository node and select any fields you want to include in the dashboard.
Type in the name of the repository and the owner name, then run the query.
{
  viewer {
    login
  }
  repository(name : "appsmith", owner : "appsmithorg") {
    id
    description
    homepageUrl
    stargazerCount
    issues {
      totalCount
    }
  }
}
You now have the totalCount of issues but not the breakdown by Open and Closed. While these would be two different queries in the REST API world, GraphQL lets you use aliases in one query to get subsets of the overall data.
GraphQL query variables
Instead of hard coding the repo name and owner, you can use query variables from the QUERY VARIABLES pane as an object.
{
  "owner": "appsmithorg",
  "repo": "appsmith"
}
You would then add the variables to the original query.
query MyQuery($repo:String!,$owner:String!) {
repository(name: $repo, owner: $owner) {
issuesOpen:issues(states: OPEN) {
totalCount
}
issuesClosed:issues(states: CLOSED) {
totalCount
}
}
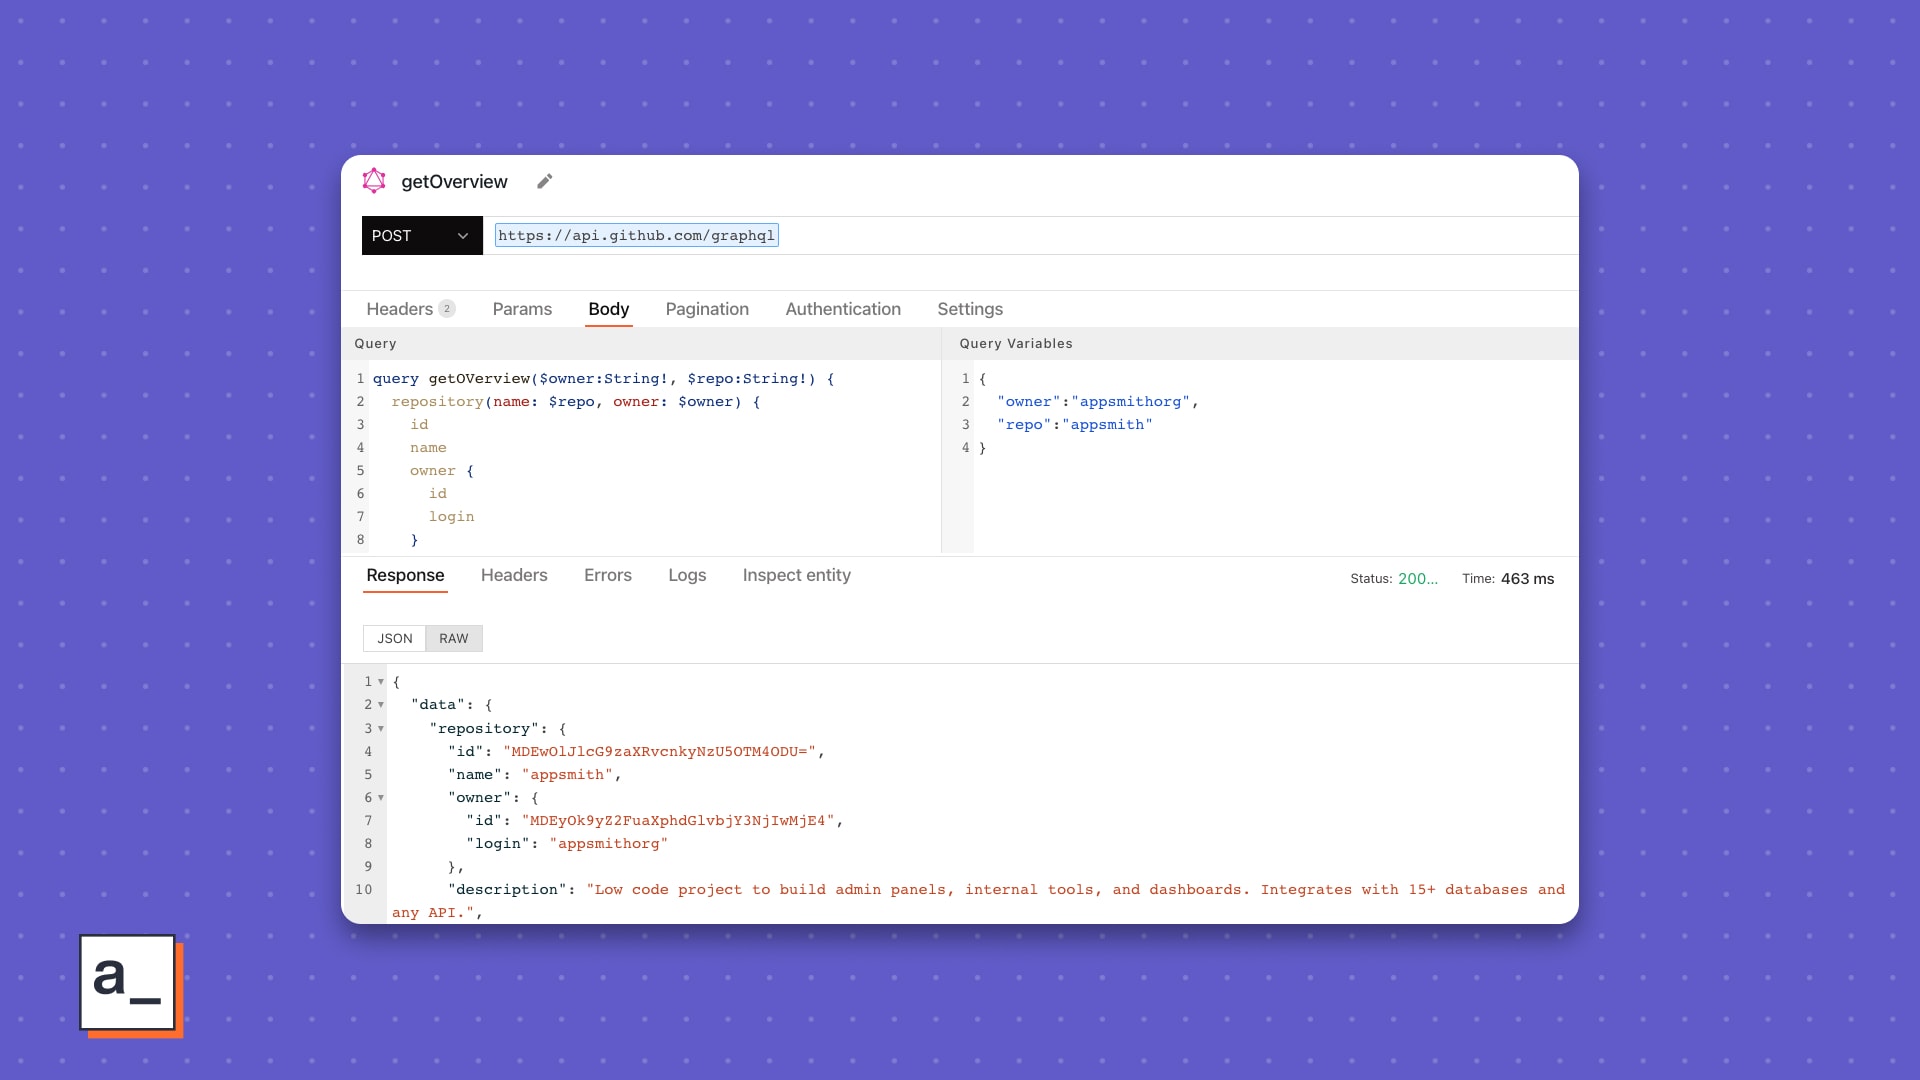
}Go through the rest of the >repository node of the Explorer and add any other fields you’d like for your dashboard, using aliases where needed to get subtotals. The final result should look something like ↓.
query getOVerview($owner:String!, $repo:String!) {
repository(name: $repo, owner: $owner) {
id
name
owner {
id
login
}
description
homepageUrl
stargazerCount
collaborators {
totalCount
}
watchers {
totalCount
}
forkCount
diskUsage
issues_open: issues(states: OPEN) {
totalCount
}
issues_closed: issues(states: CLOSED) {
totalCount
}
PRs_open: pullRequests(states: OPEN) {
totalCount
}
PRs_merged: pullRequests(states: MERGED) {
totalCount
}
}
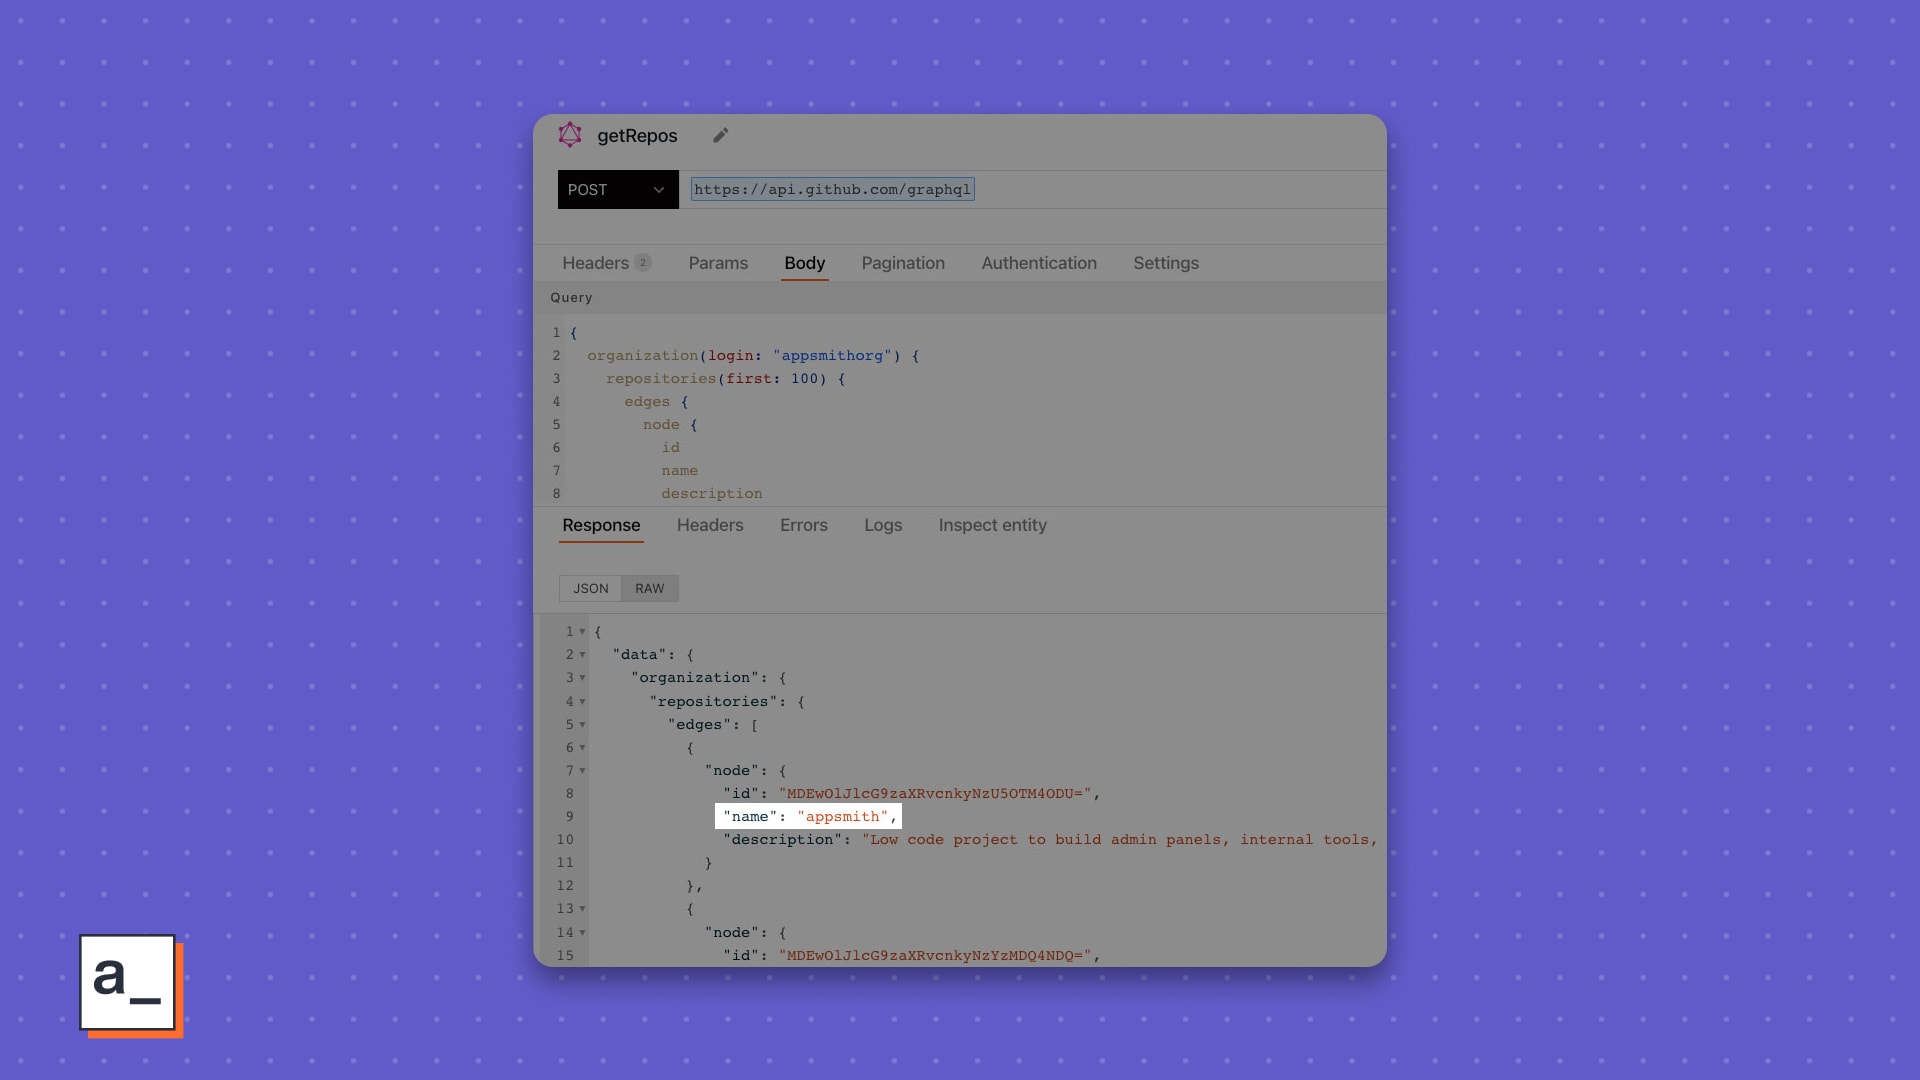
}While you’re here, create one more query to get a list of repos for your GitHub Organization. This will be useful in offering a picklist of repo names to choose from later.
query {
  organization(login: "appsmithorg") {
    repositories(first: 100) {
      edges {
        node {
          name
        }
      }
    }
  }
}
Connecting the GraphQL API in Appsmith
Now that you have your GraphQL API token and the queries for your dashboard, let’s set up an authenticated GraphQL API in Appsmith.
Start a new app, then add a new datasource from the Explorer in the left nav.
Choose Authenticated GraphQL API and enter the following values in the fields shown
URL: https://api.github.com/graphql
Authentication Type: Bearer Token
Bearer: {{value from GitHub}}
The Bearer Token value is they access token you generated on Github.
Name and save the datasource.
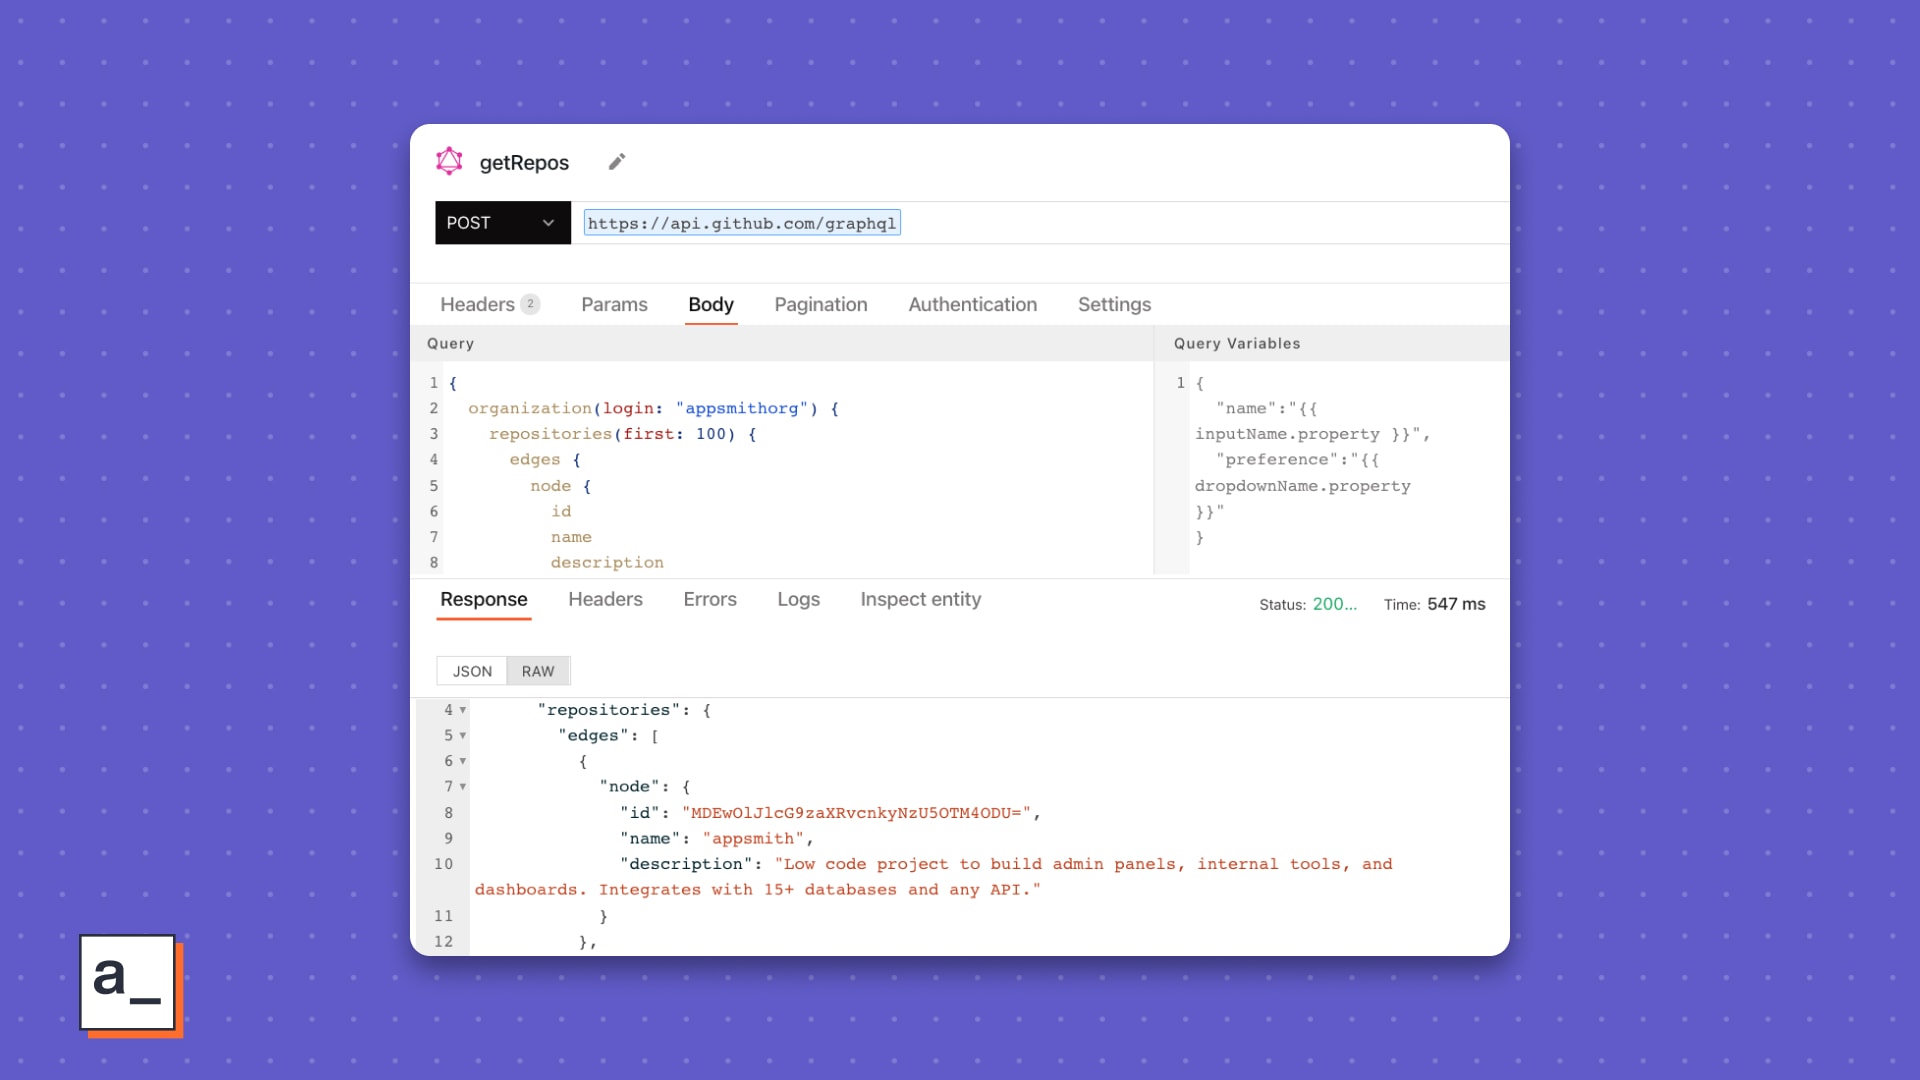
Add a new API to this datasource.
Copy the query from GitHub’s GraphQL Explorer into the Body of the API.
Copy the query variables from GitHub to the Query Variables pane.
Run the API.
Add one more API for the repo list, and copy over the query and variables from GitHub.
Presenting data in widgets
First add an Input Widget for the owner name.
💡 Smith’s tip
Give it a descriptive name you can reference uniquely later.
I prefer using a short prefix for the widget type, e.g., in (for input), followed by an underscore, and then a descriptive term for the data it presents, e.g., in_owner. When I dynamically need the text value in the widget, I can reference it with {{in_owner.text}} in queries, JS toggles on widget props, or JS Objects in Appsmith.
Next, add a Select Widget for the repository name. With this widget, the user’s input can be referenced as {{in_repo.selecteOptionValue}}.
The Select Widget requires an array of key-value pairs denoted label and value to supply the picklist’s options. If you look closer at the API response, you see a list of repo names but the data isn’t structured for this widget yet.
Enter JavaScript
First, let’s map over the edges and return an array of the nodes.
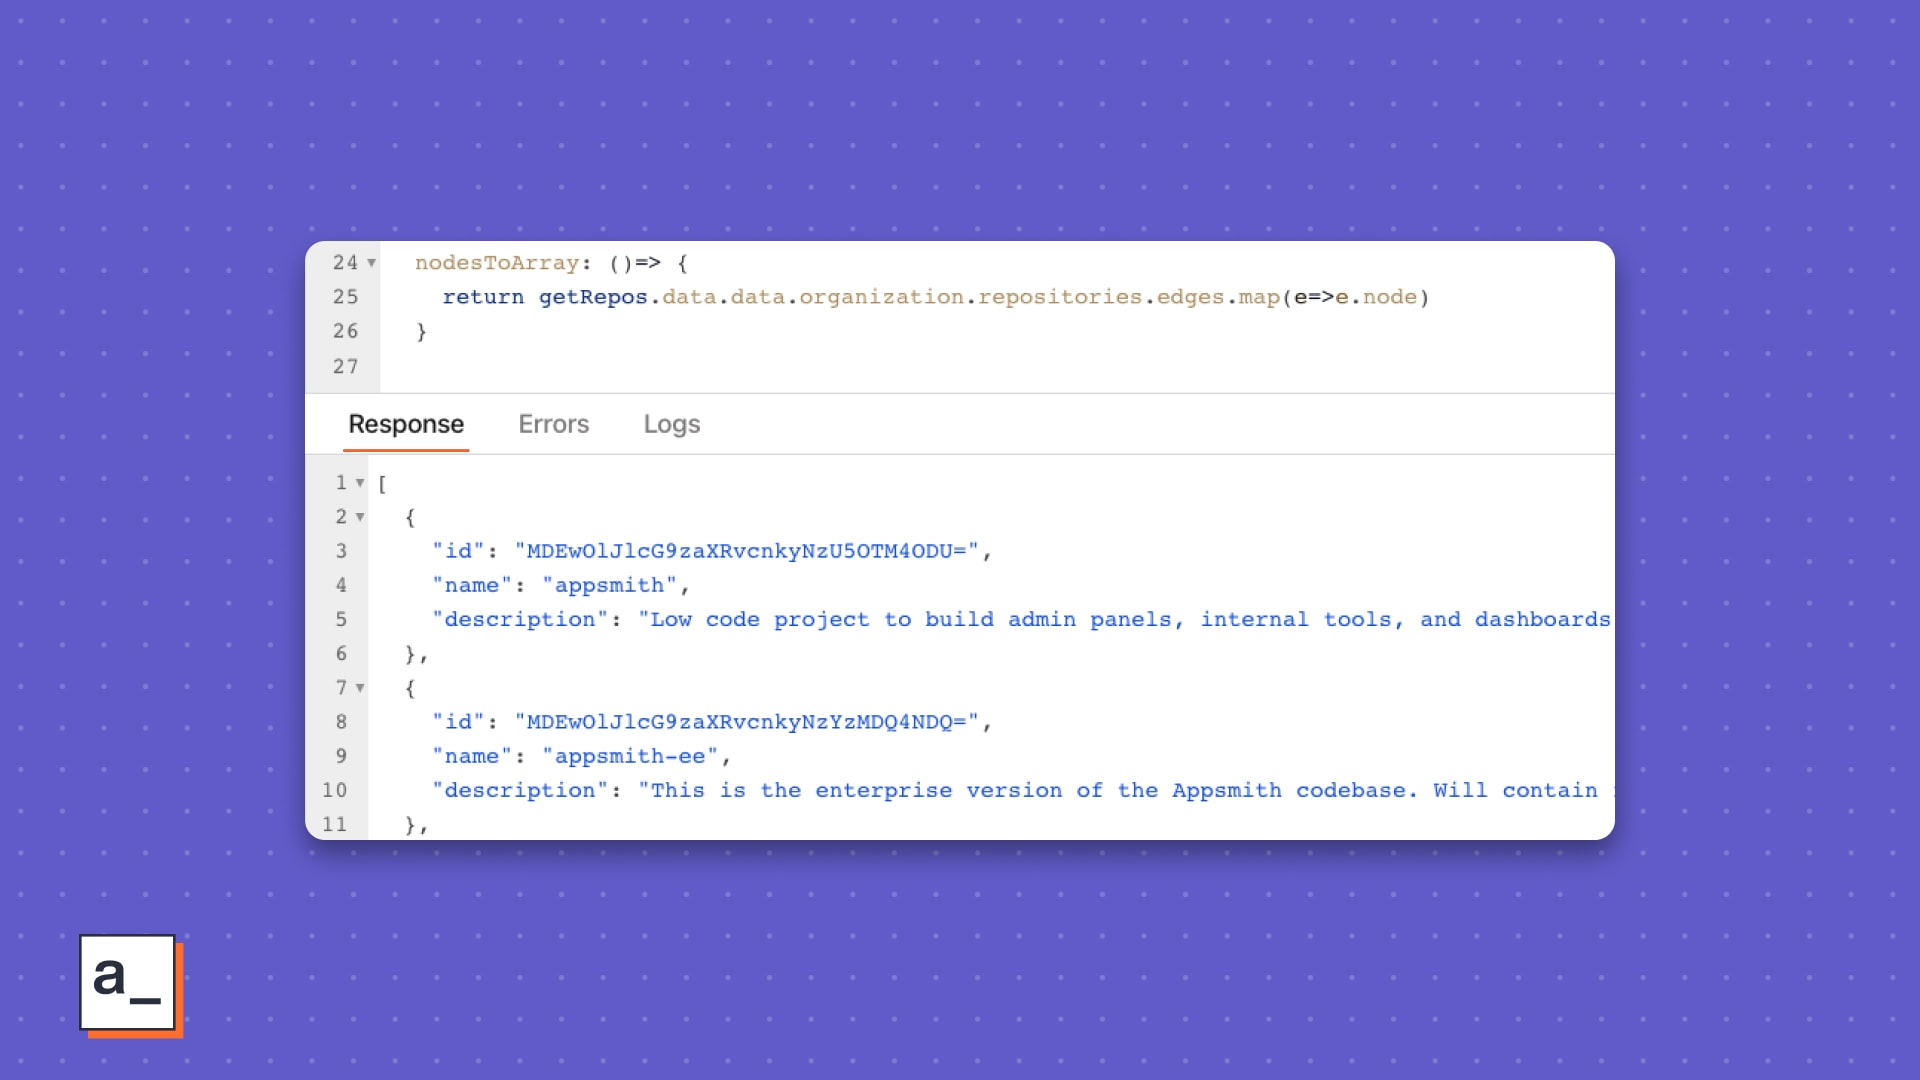
Then map over the nodes array to return the {label, value} array expected by the Select Widget.
nodesToArray: ()=> {
		return getRepos.data.data.organization.repositories.edges.map(e=>e.node)
			.map(n=>({label:n.name,value:n.name}))
}
This lets you bind the data to the Select widget so when the end-user selects a repo name from the picklist, the query to the API can automatically be triggered.
![For the Default Selected Value, you can use [0].value to default it to the first option in the picklist which is the first option in the query response.](/_next/image?url=https%3A%2F%2Fimages.ctfassets.net%2Flpvian6u6i39%2F5w915SELS4qYWO2klBtxRB%2F85f096bb5dbd59e5bd77e4d17c6c6a26%2F63596c1f271daf23a37449f6_Binding_the_transformed_name_node_array_to_Select__Appsmith.jpeg&w=3840&q=90)
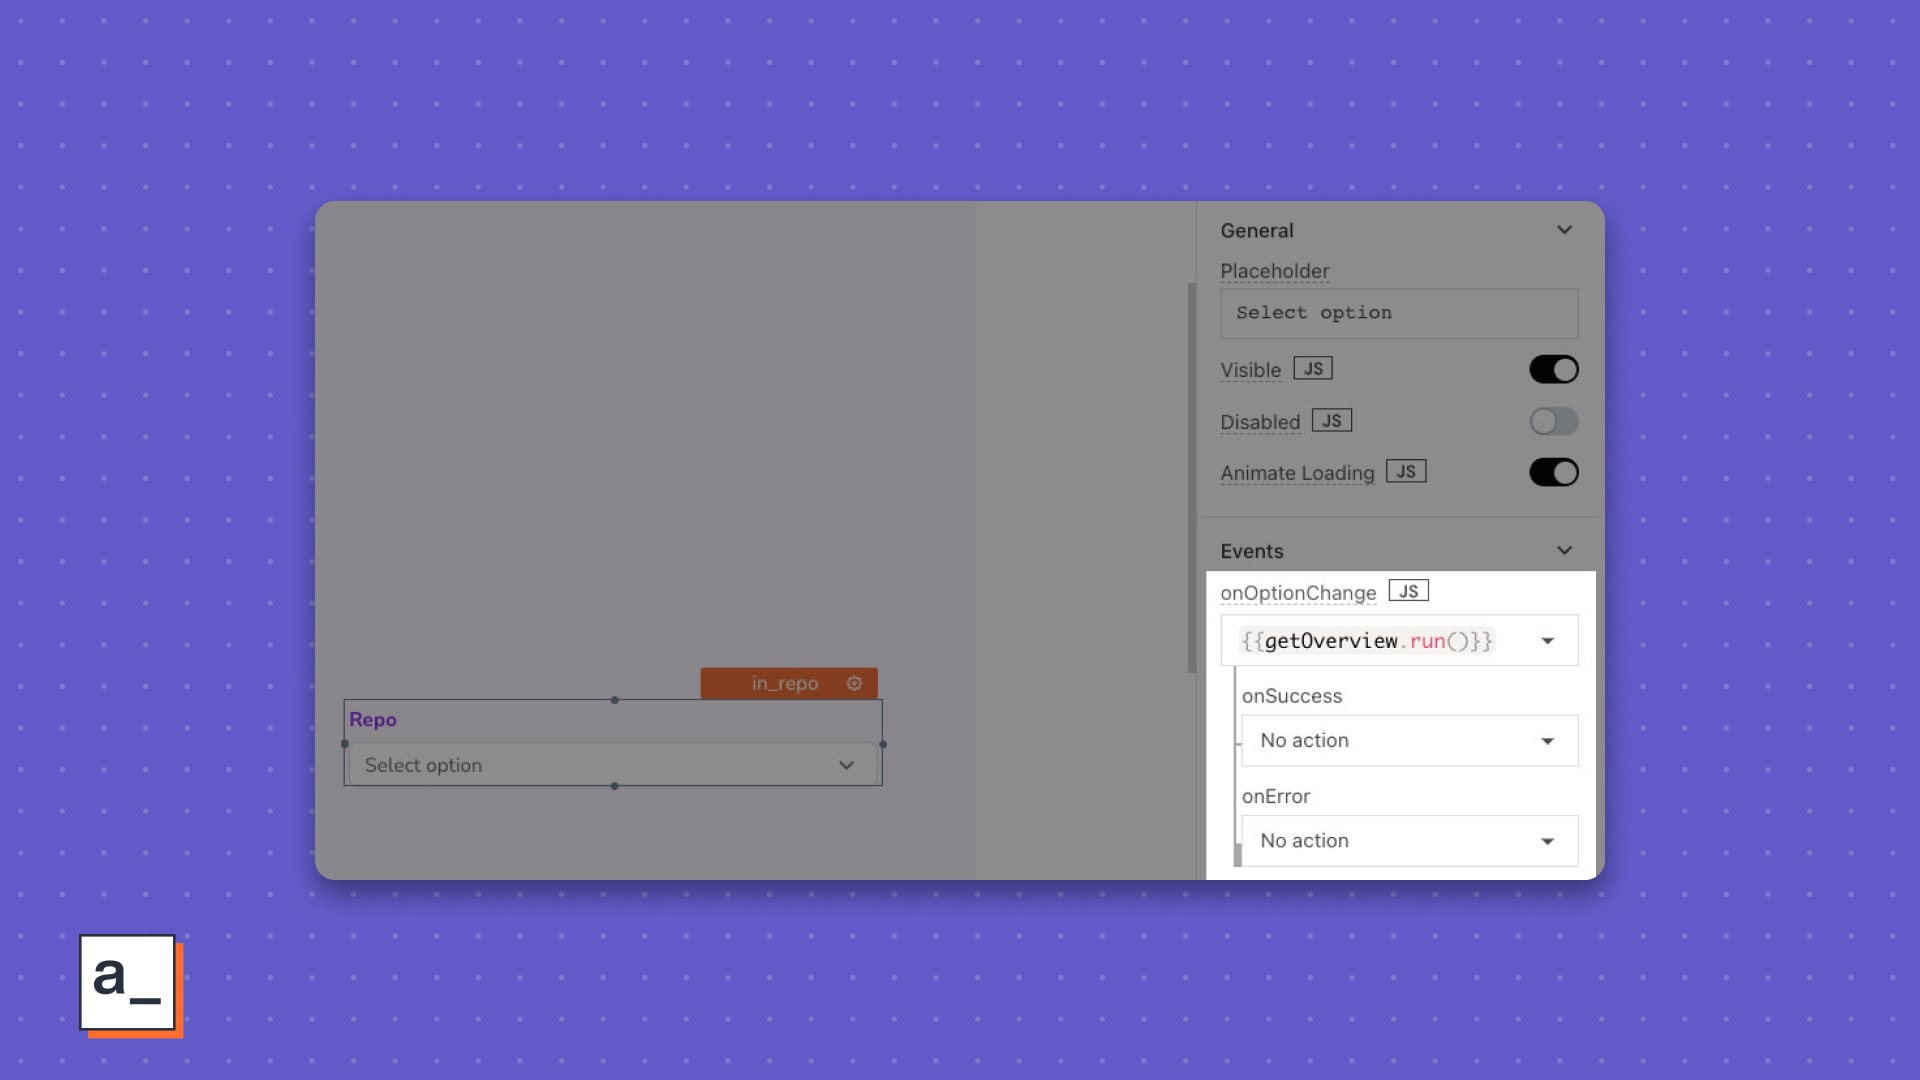
In the Select widget’s properties, set the onOptionChange event to trigger the query run the the getOverview API automatically for each option selected.
Edit the getOverview API query variables to reference the new widgets. You can also add a fallback value in case the input is blank.
{
  "owner": {{in_owner.text ||'appsmithorg'}},
  "repo": {{in_repo.selectedOptionValue ||'appsmith'}}
}
The ||, the symbol for the logical OR operator, is to declare a default if the repo name is blank.
Next up? Choosing the right widget for the data returned by the API. This part needs some understanding of the data and its structure. Here’s what the query response looks like.
//getOverview.data:
{
  "data": {
    "repository": {
      "id": "MDEwOlJlcG9zaXRvcnkyNzU5OTM4ODU=",
      "name": "appsmith",
      "owner": {
        "id": "MDEyOk9yZ2FuaXphdGlvbjY3NjIwMjE4",
        "login": "appsmithorg"
      },
      "description": "Low code project to build admin panels, internal tools, and dashboards. Integrates with 15+ databases and any API.",
      "homepageUrl": "https://www.appsmith.com",
      "stargazerCount": 21504,
      "collaborators": {
        "totalCount": 113
      },
      "watchers": {
        "totalCount": 232
      },
      "forkCount": 1849,
      "diskUsage": 286069,
      "issues_open": {
        "totalCount": 2579
      },
      "issues_closed": {
        "totalCount": 7458
      },
      "PRs_open": {
        "totalCount": 87
      },
      "PRs_merged": {
        "totalCount": 5893
      }
    }
  }
}
One way could be having a widget for each data point but that could very easily get out of hand if you have hundreds of fields. We will keep the Appsmith spirit of easy and fast and choose something more thoughtful.
Let’s try the Table
How about a JSONForm?
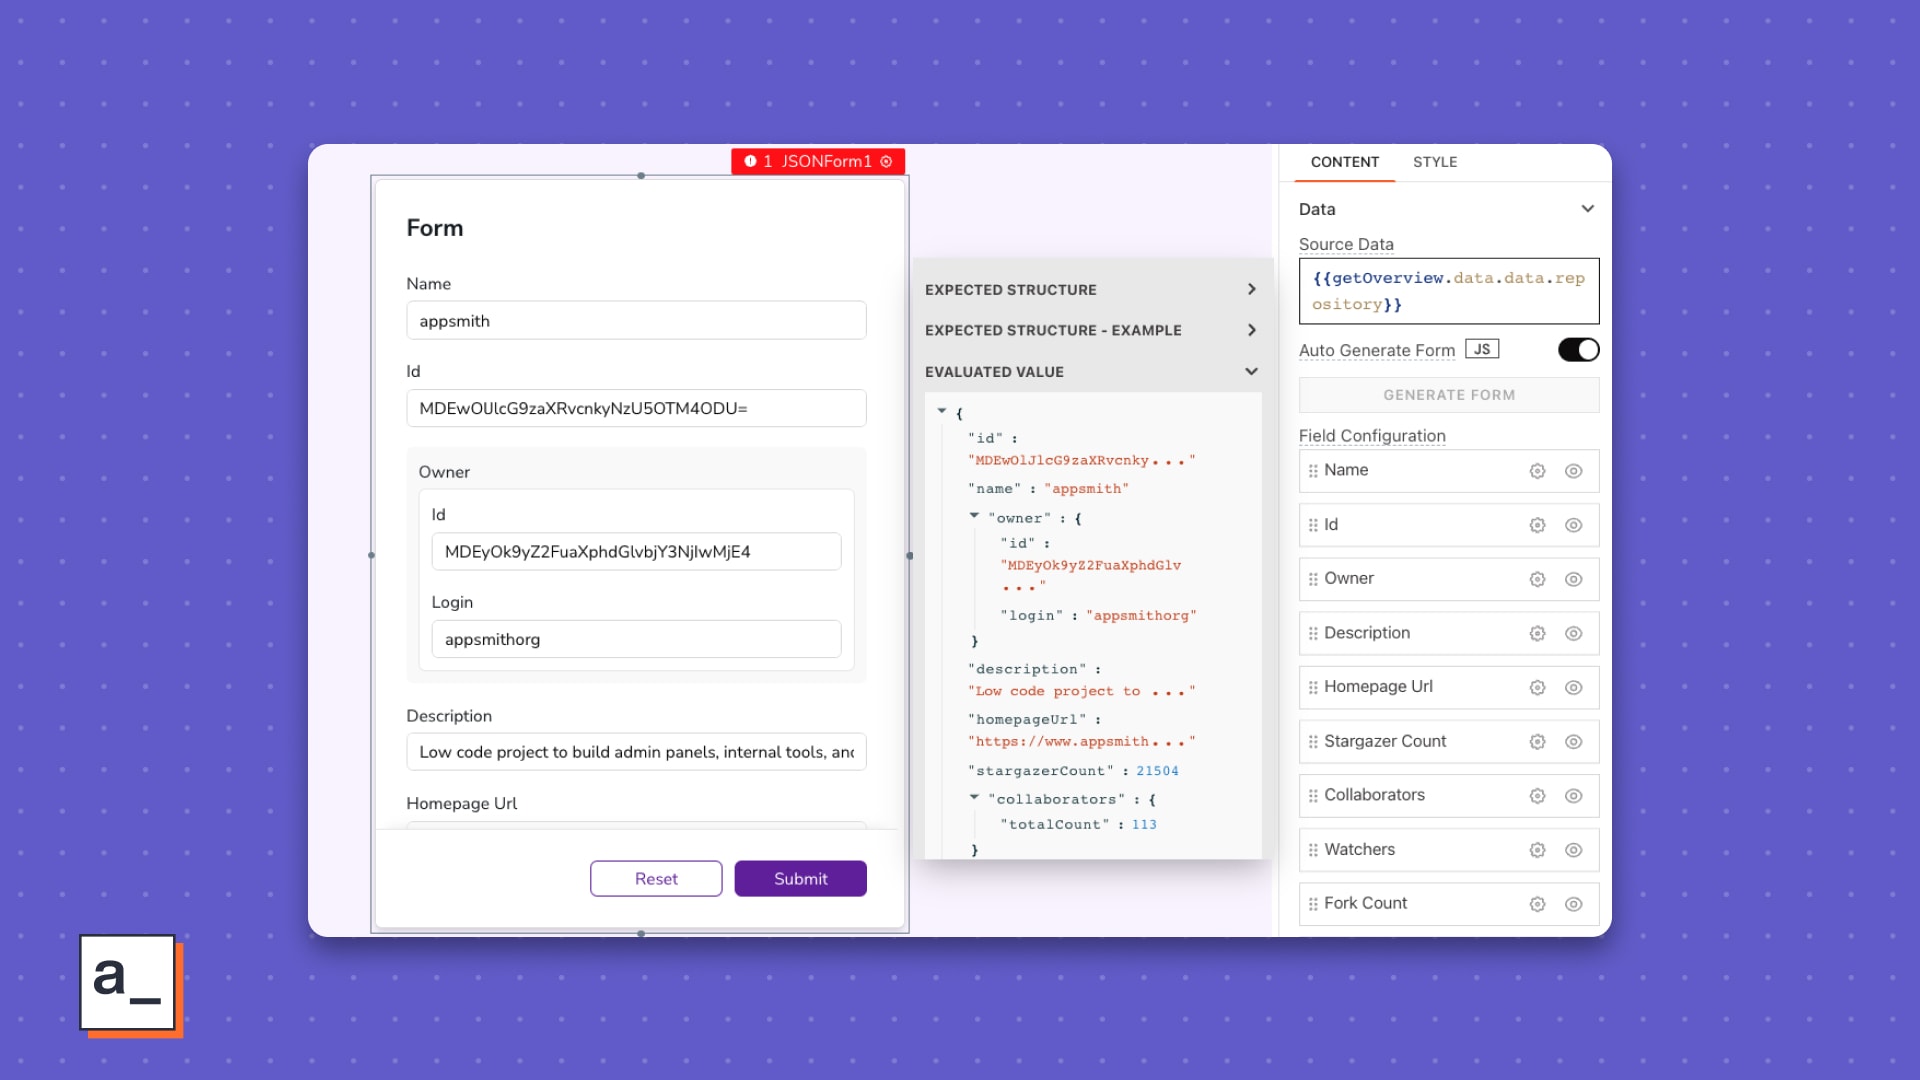
We need a pivot-table of the data, but the current JSON structure isn’t quite right for that. So, we'll transform the data on the fly.
More JavaScript
Your dashboard building trip so far has been without code. To build the UI right for the data, though, you will need to enter coding territory and introduce this data to our good friend, JavaScript.
1. Object.keys()
Instead of one horizontal row, what if we could have one column for the field names and one for the values? The new data format should look something like ↓.
[
  {
    "field_name": "id",
    "value": "MDEwOlJlcG9zaXRvcnkyNzU5OTM4ODU="
  },
  {
    "field_name": "Name",
    "value": "appsmith"
  },
...
]
Start with a function that returns a list of the fields, or properties, of the repository object.
objToRows: (obj=getOverview.data.data.repository) => {
		return Object.keys(obj)
	},
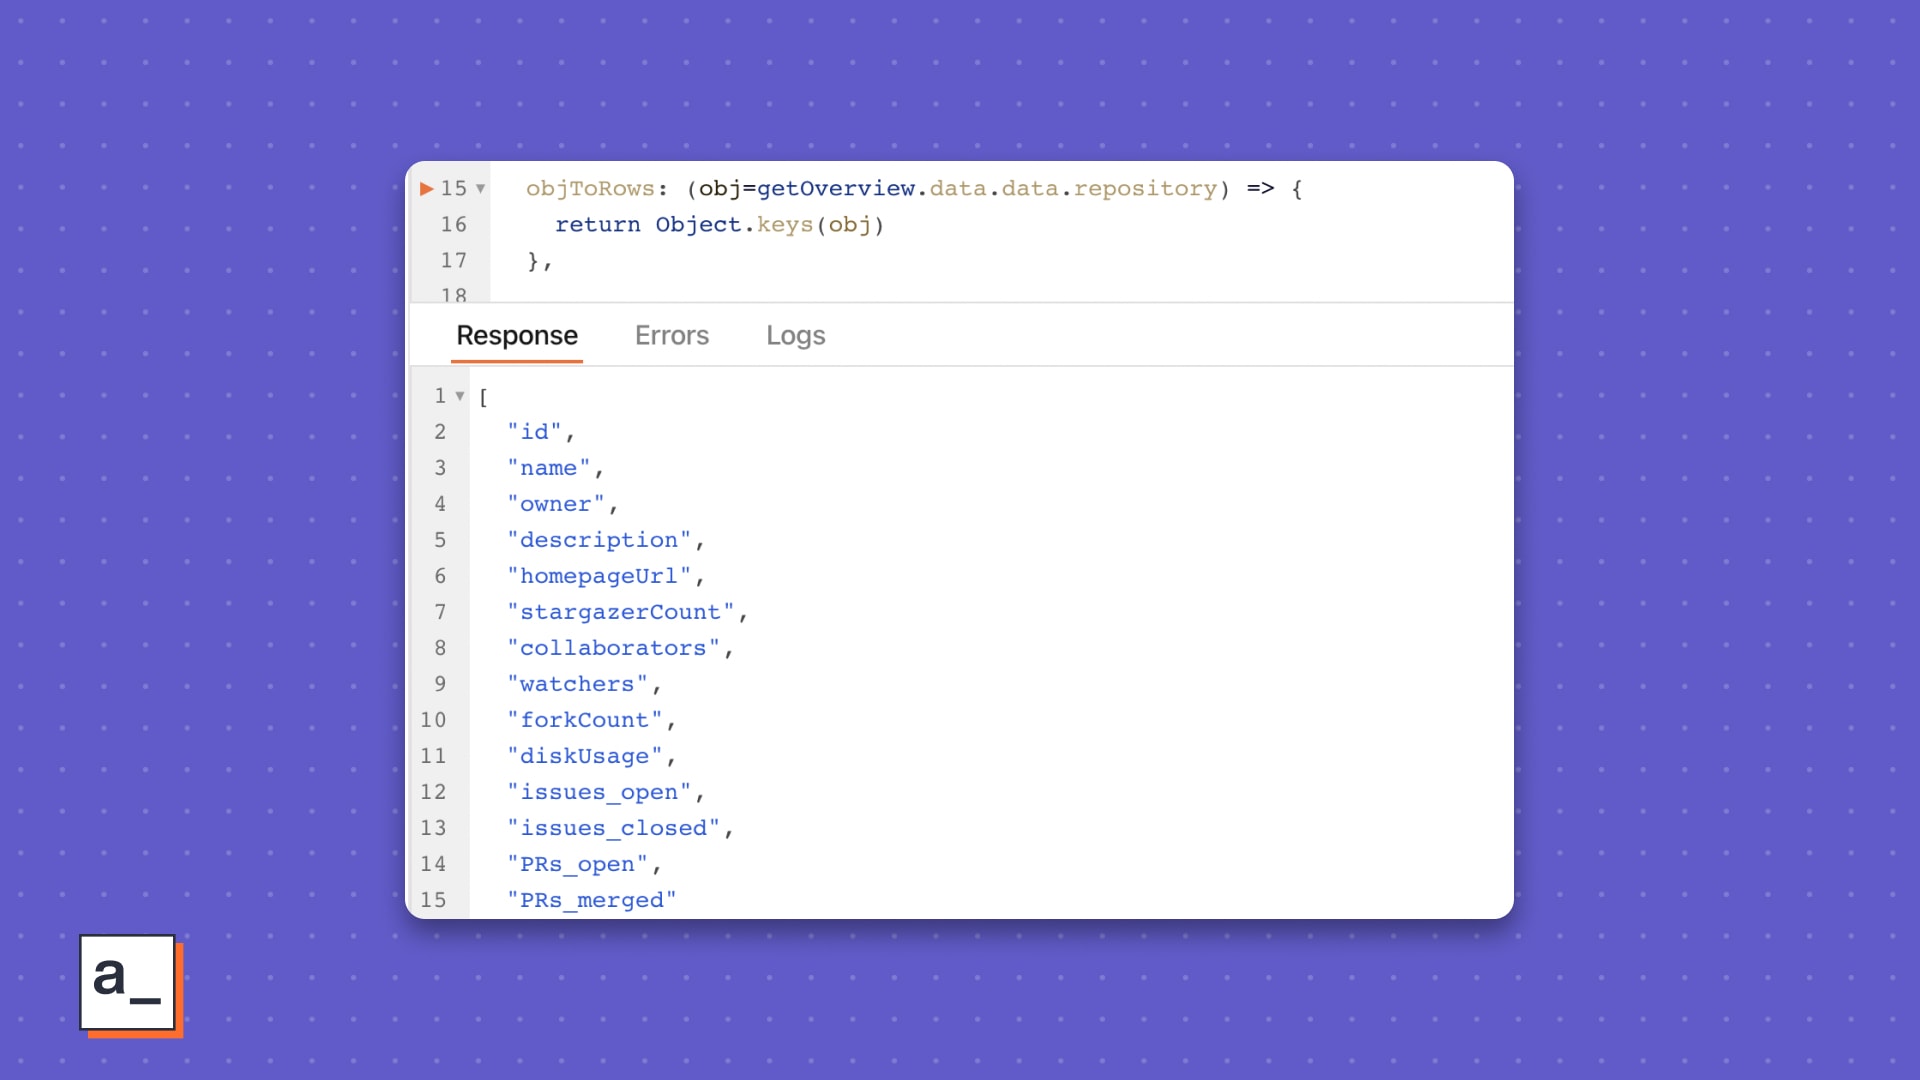
🧠 Use Object.keys(object) to return an array of property names from an object.
2. Reduce
Next, you will need to iterate over these properties and return a new row object for our pivot table. The end result should be an array of objects with two properties, one for the field name and one for the value.
Sounds like a job for the reduce method.
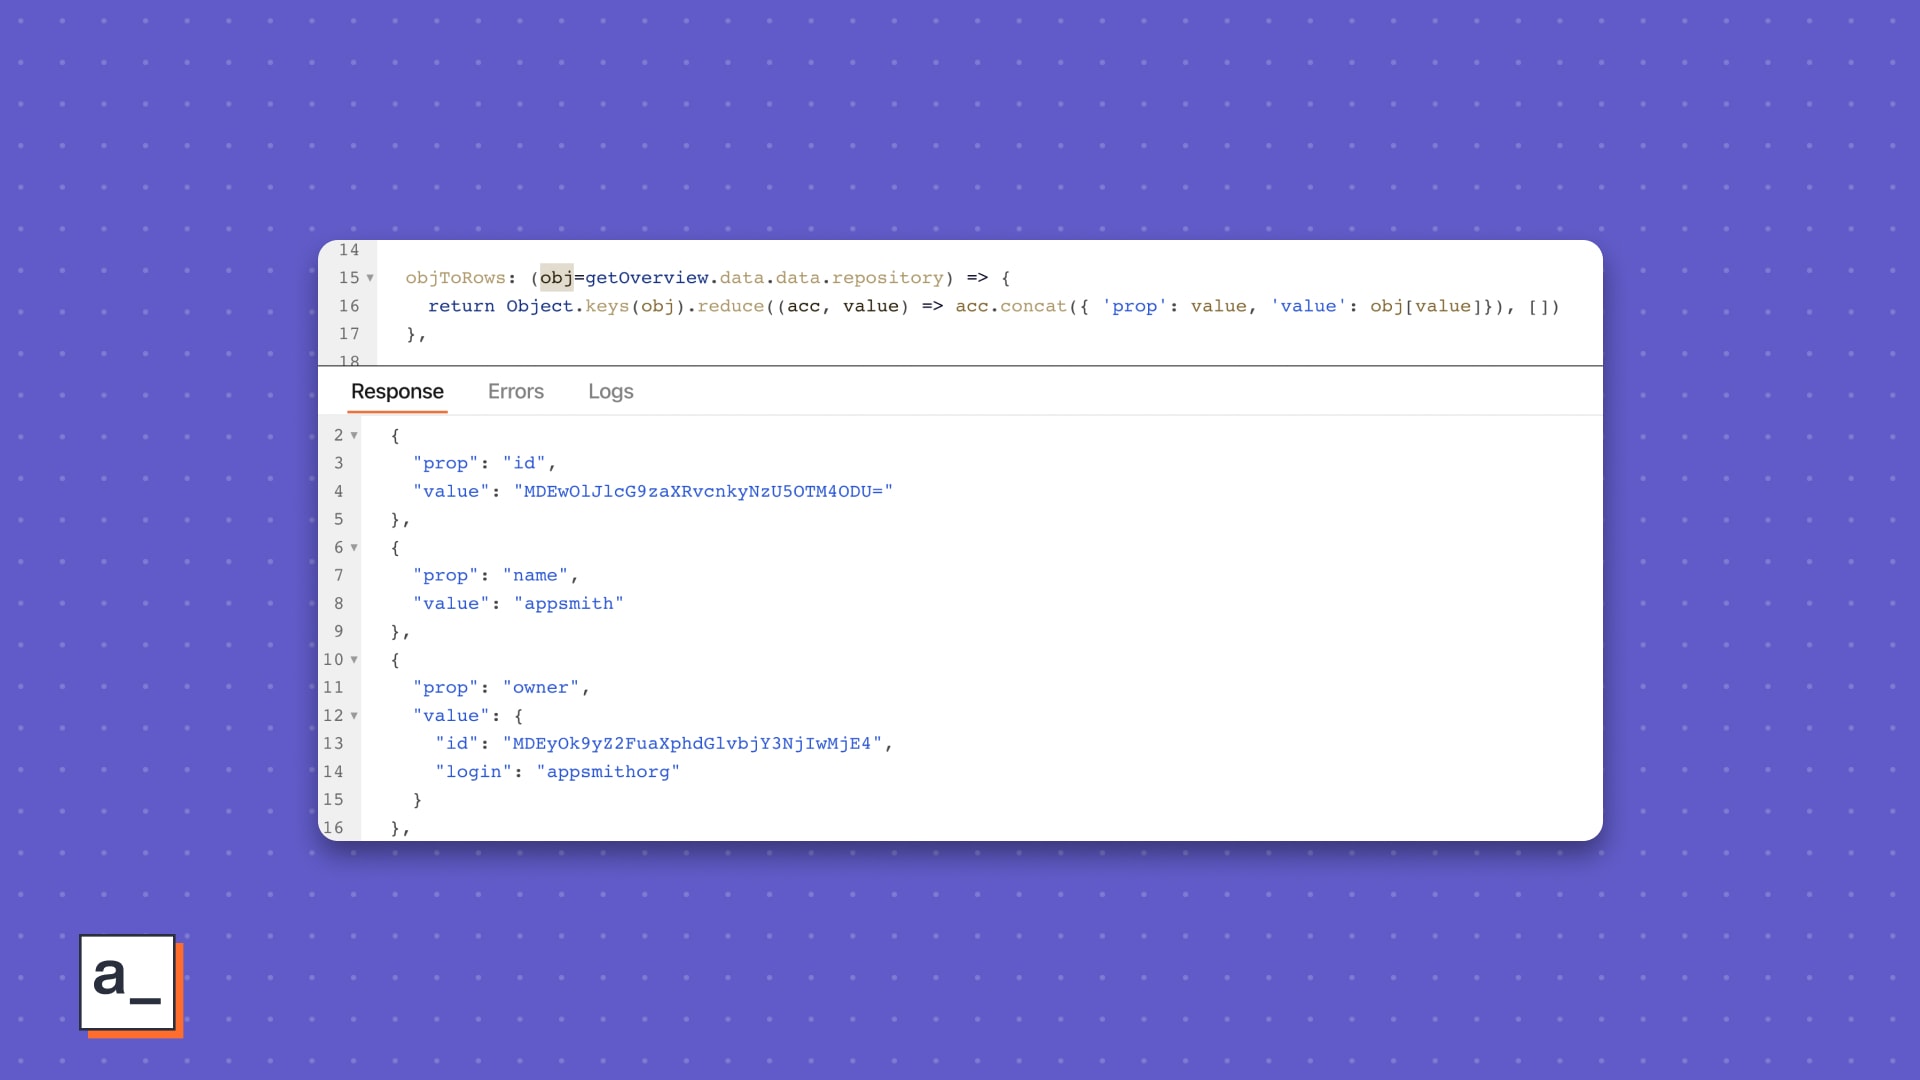
Start with an empty array and add a new object for each property in the Object.keys() array.
objToRows: (obj=getOverview.data.data.repository) => {
		return Object.keys(obj).reduce((acc, value) => acc.concat({ 'prop': value, 'value': obj[value]}), [])
	}
Next up? Choosing the right widget for the data returned by the API. This part needs some understanding of the data and its structure. Here’s what the query response looks like.
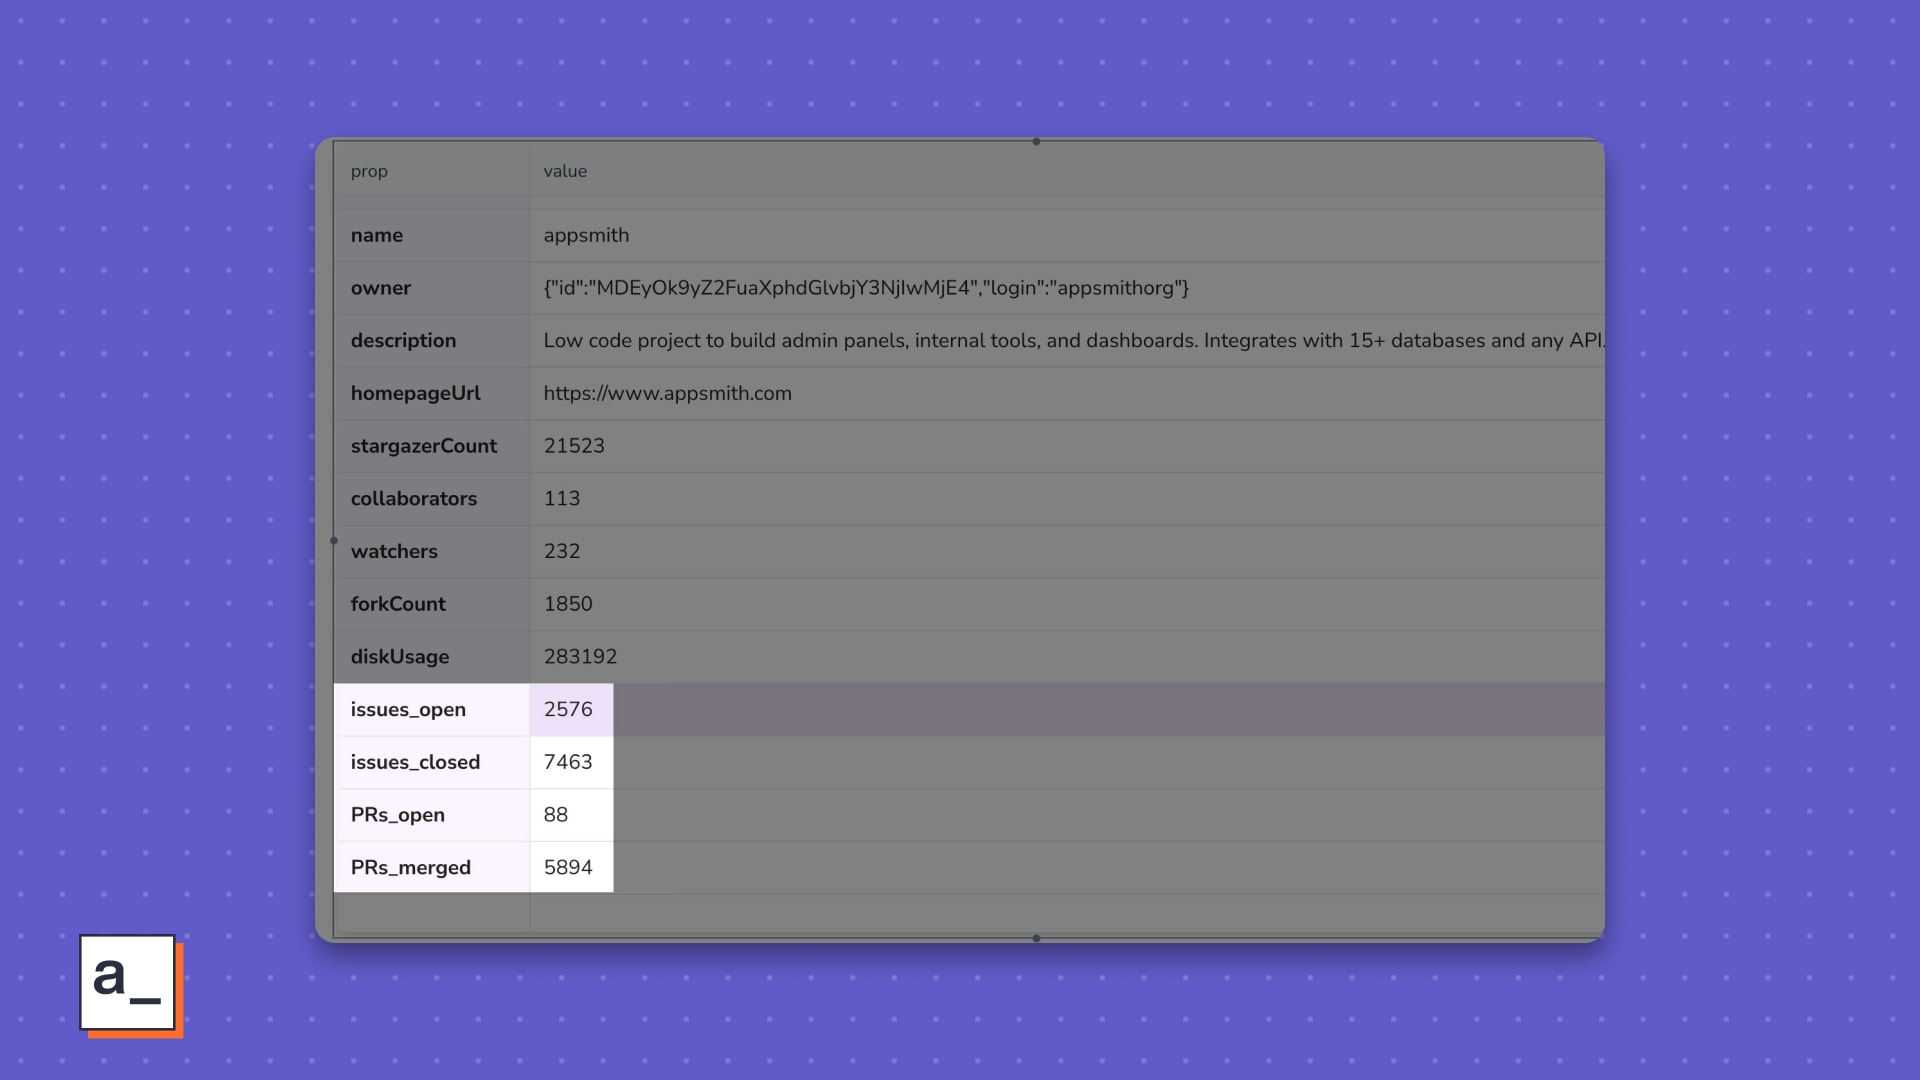
Presenting this new and transformed data on the Table should look like ↓.
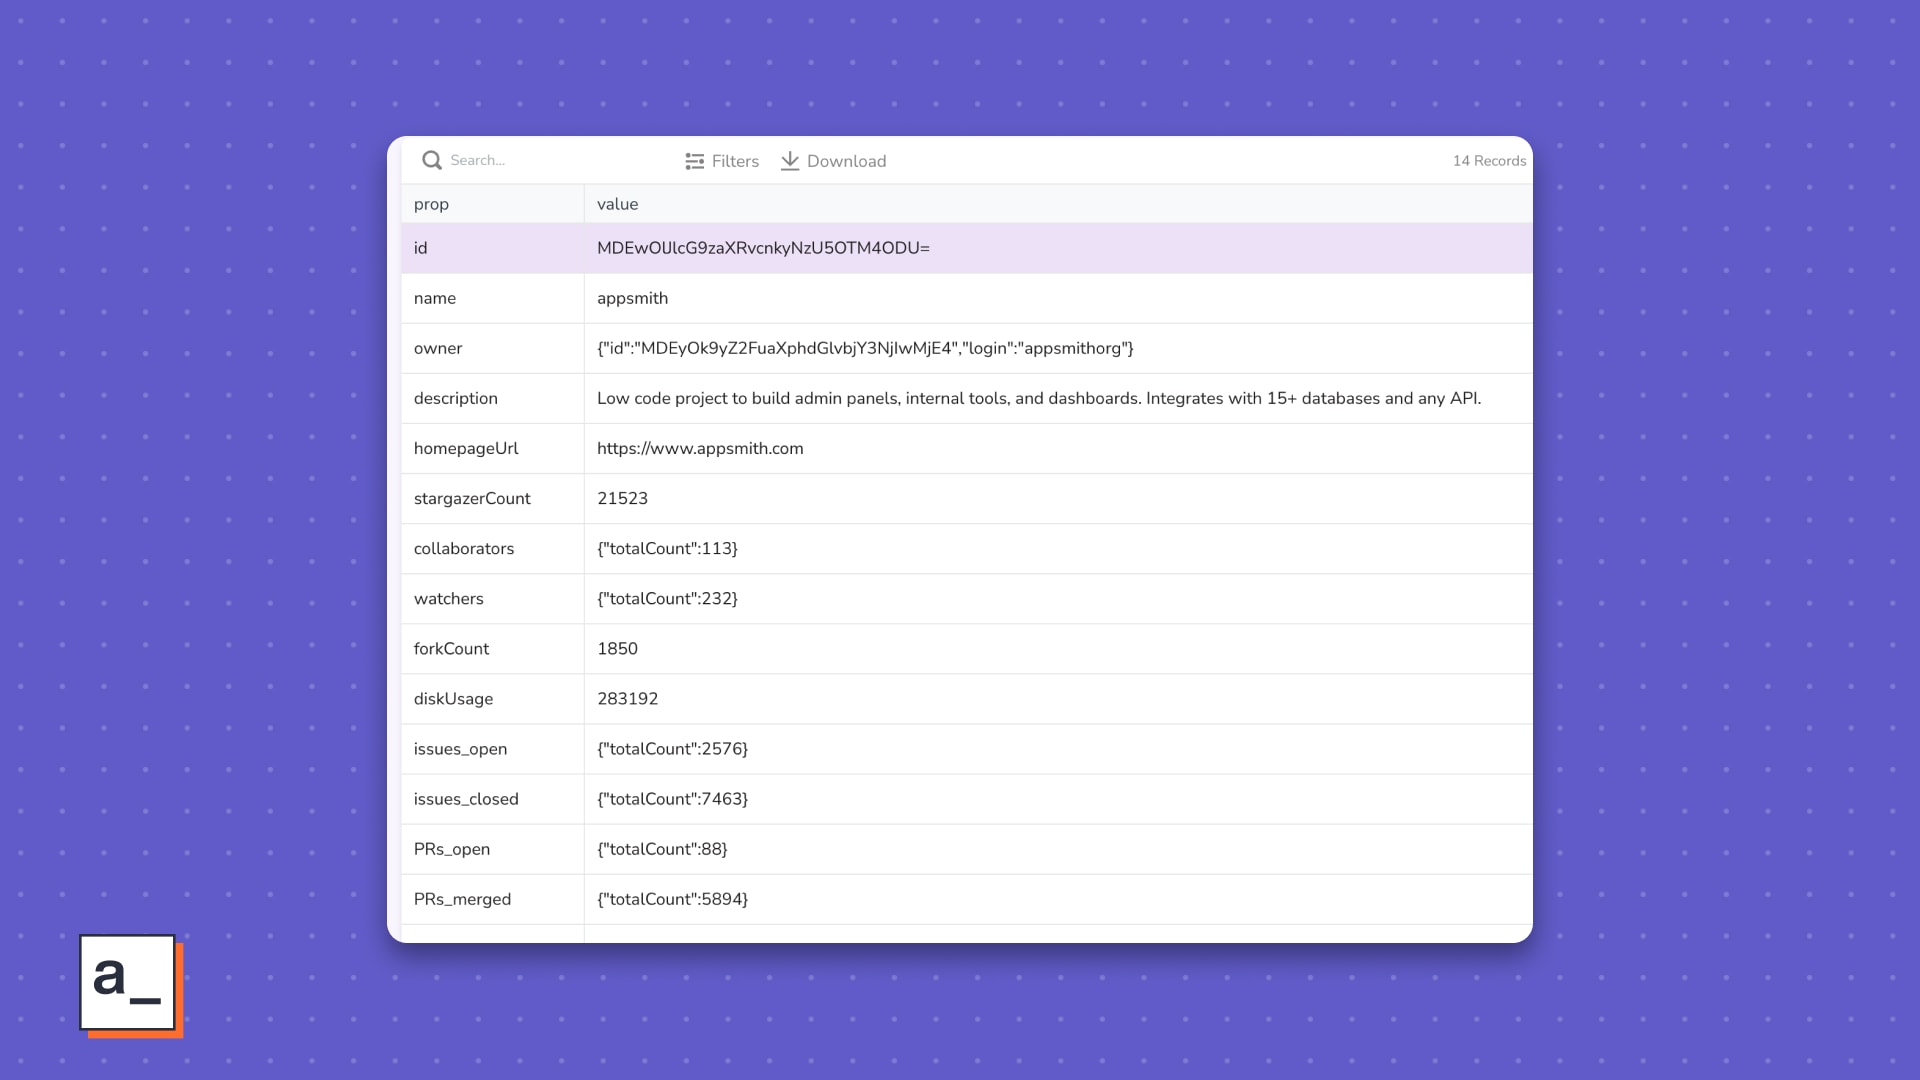
Your header row is a column now—magic!—, so it should look better to format the first column differently.
☝🏾 Disabling search, filters, download, and pagination options will help clean up the UI further. You don’t need those options for your dashboard anyway.
3. Ternary operators
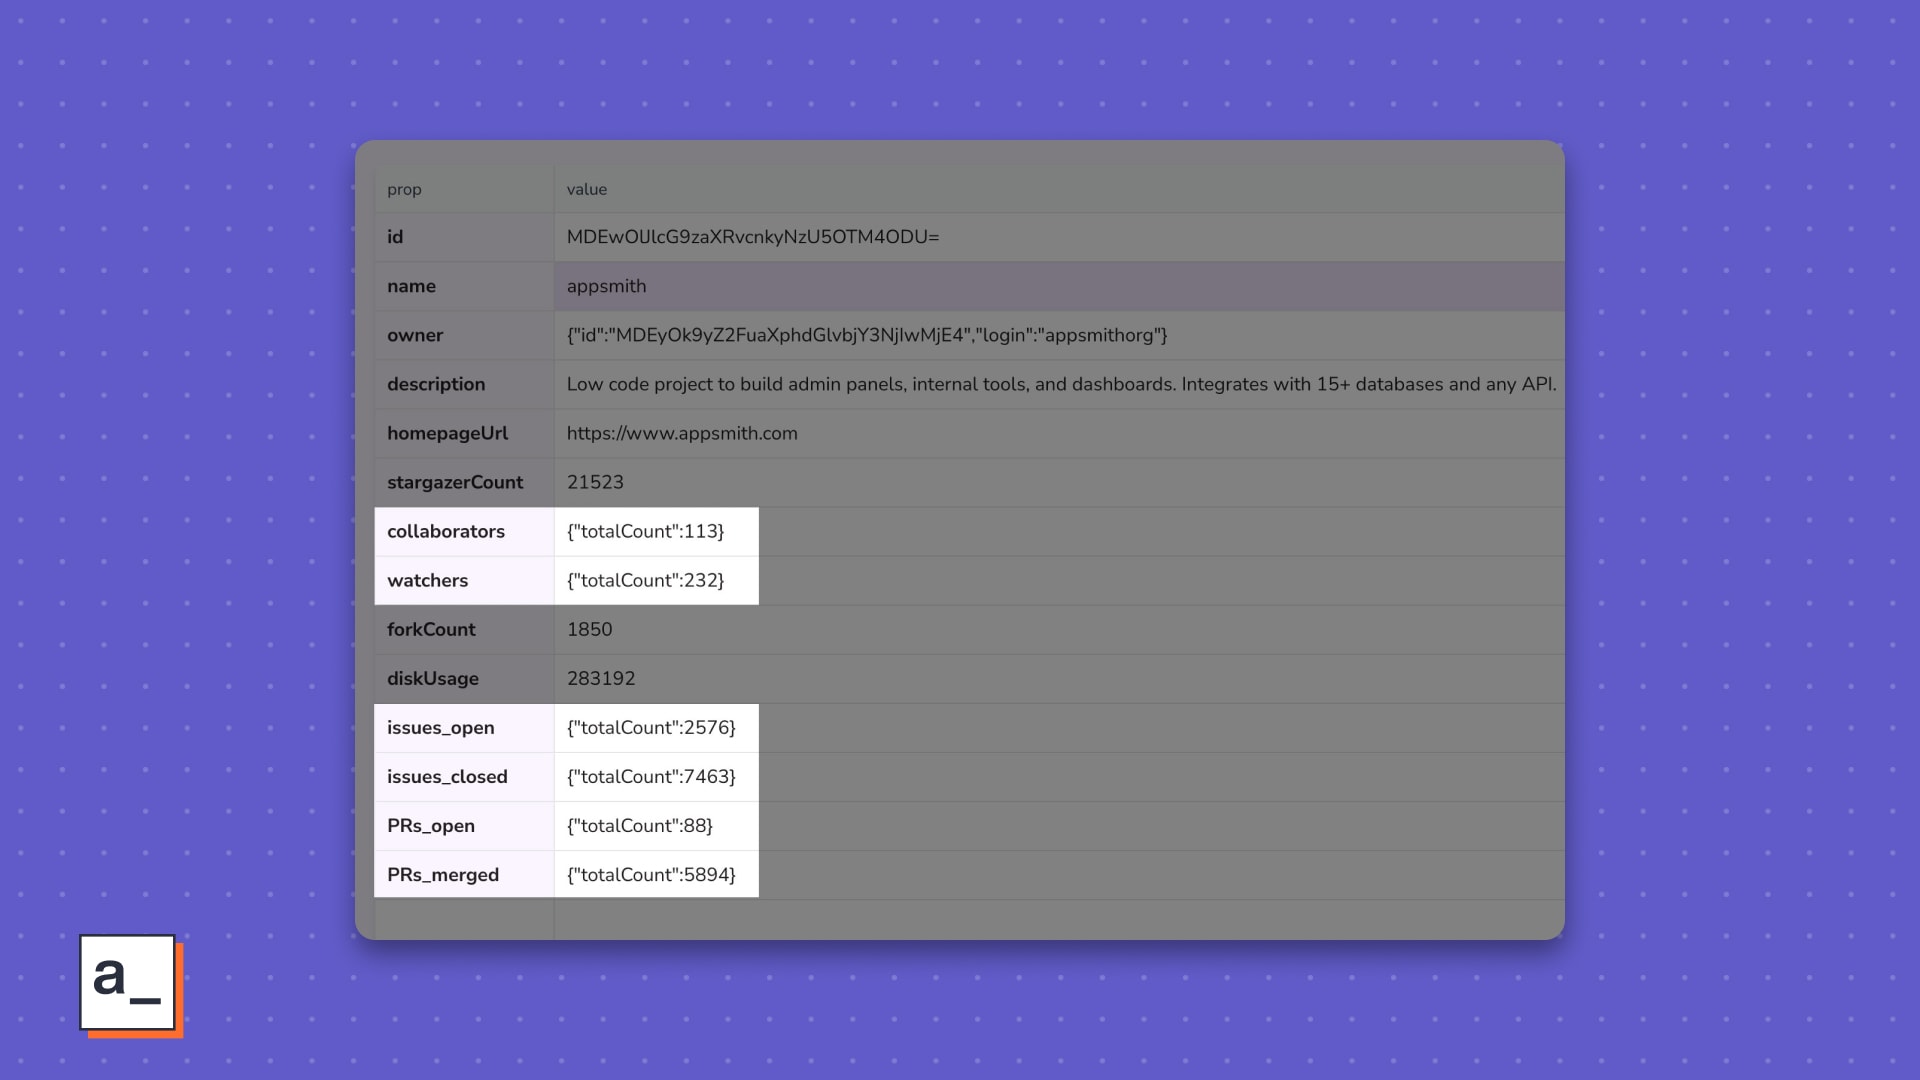
Those nested totalCount fields are kinda ugly. It would be much better if each value in the value column showed only the count. Before you get to doing it dynamically, let’s walk through the logic in plain English first.
If the value in the value column is an object and it has only one property, show only the value for that property.
Use typeof to see if the value is an object, then use Object.keys().length to see if there is only one property.
Code logic
if ( typeof value == 'object' && Object.keys(value).length==1 ) ...do something
If the value in the value column is an object and it has nested properties, you want to show only the value of the nested properties, else you want to return whatever value was already there.
Use a ternary operator for this logic.
Code logic
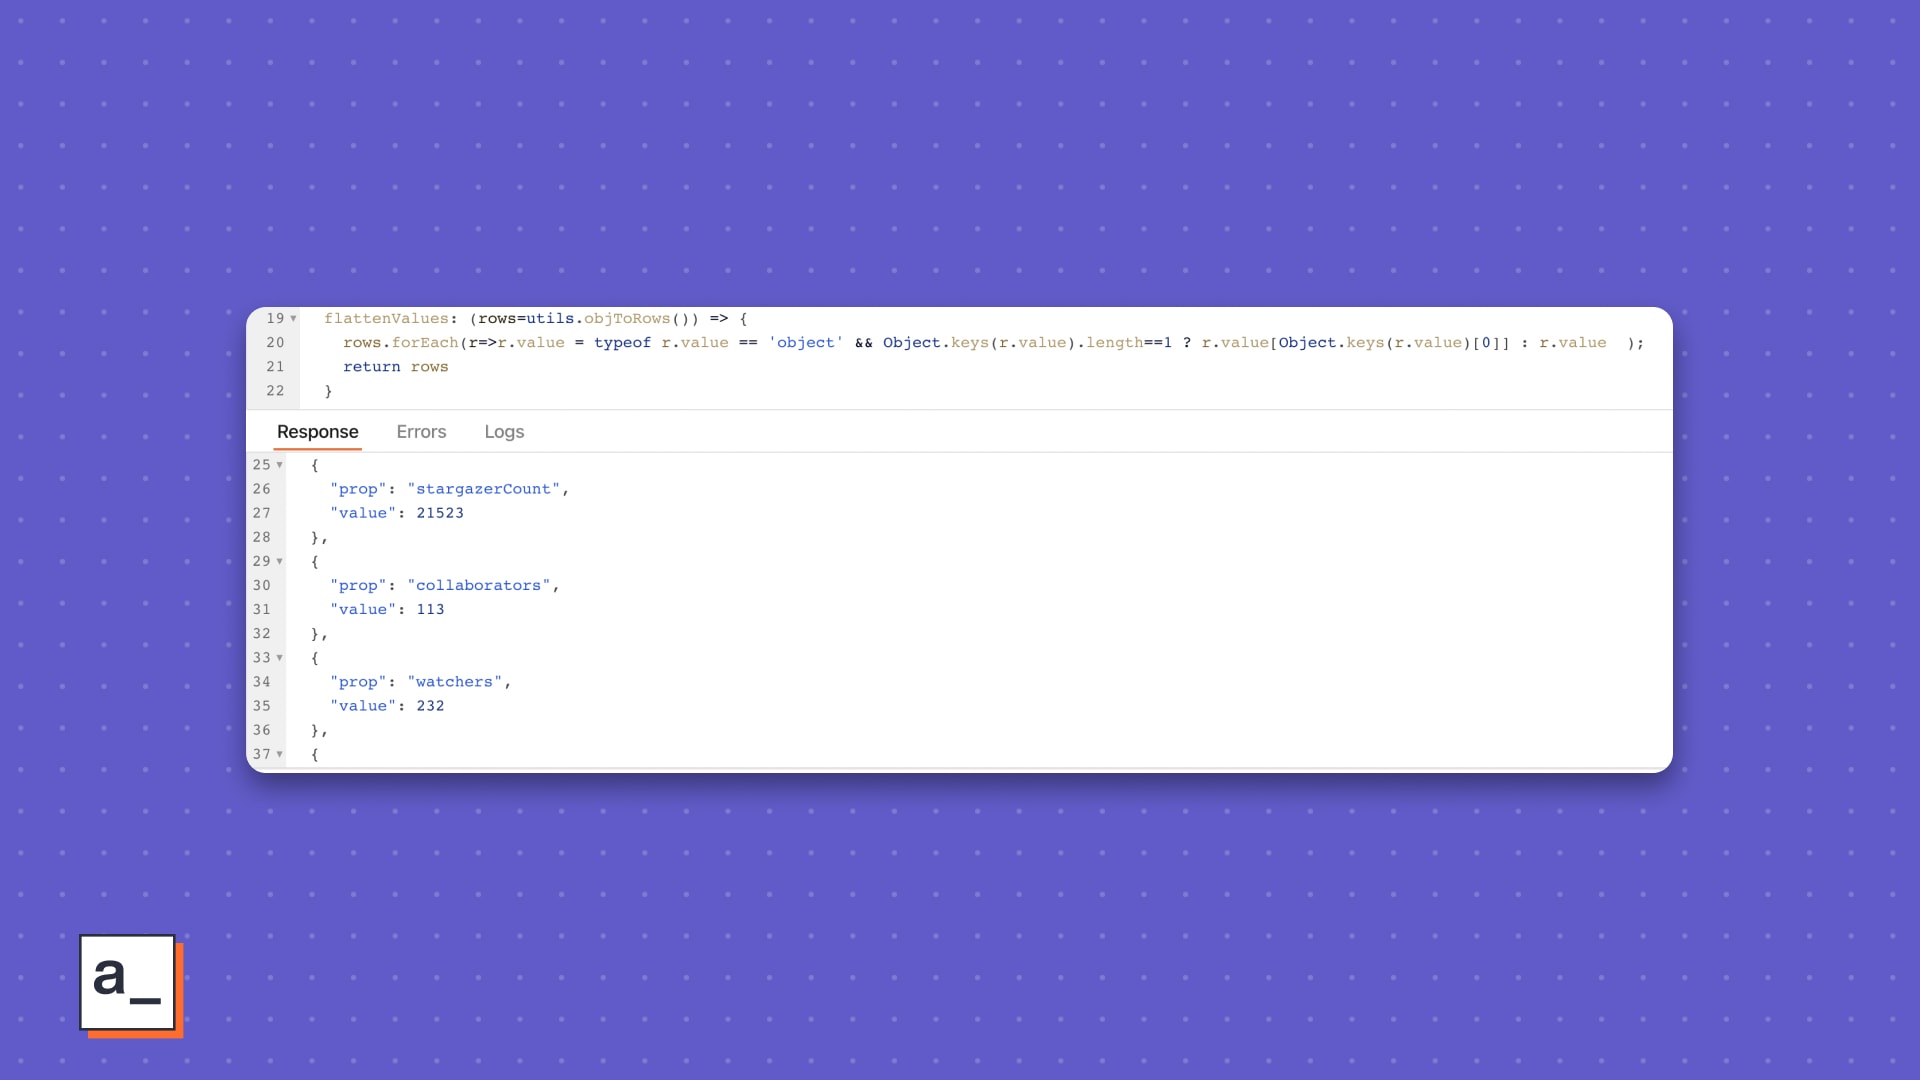
flattenValues: (rows=utils.objToRows()) => {
		rows.forEach(r=>r.value = typeof r.value == 'object' && Object.keys(r.value).length==1 ? r.value[Object.keys(r.value)[0]] : r.value  );
		return rows
	}
“”GraphQL’s claim to fame is a lot fewer API calls than REST. As you have seen so far, the dashboard for the repo of interest is a single API call. You can continue tweaking the request body to match the exact data you need for the UI to get all of it in a single API response.
For finishing touches, move the in_repo and in_owner widgets into a new container for the header and add a second container for the Table.

Finally, add a border color and a width of 1.5 to make it look nice.
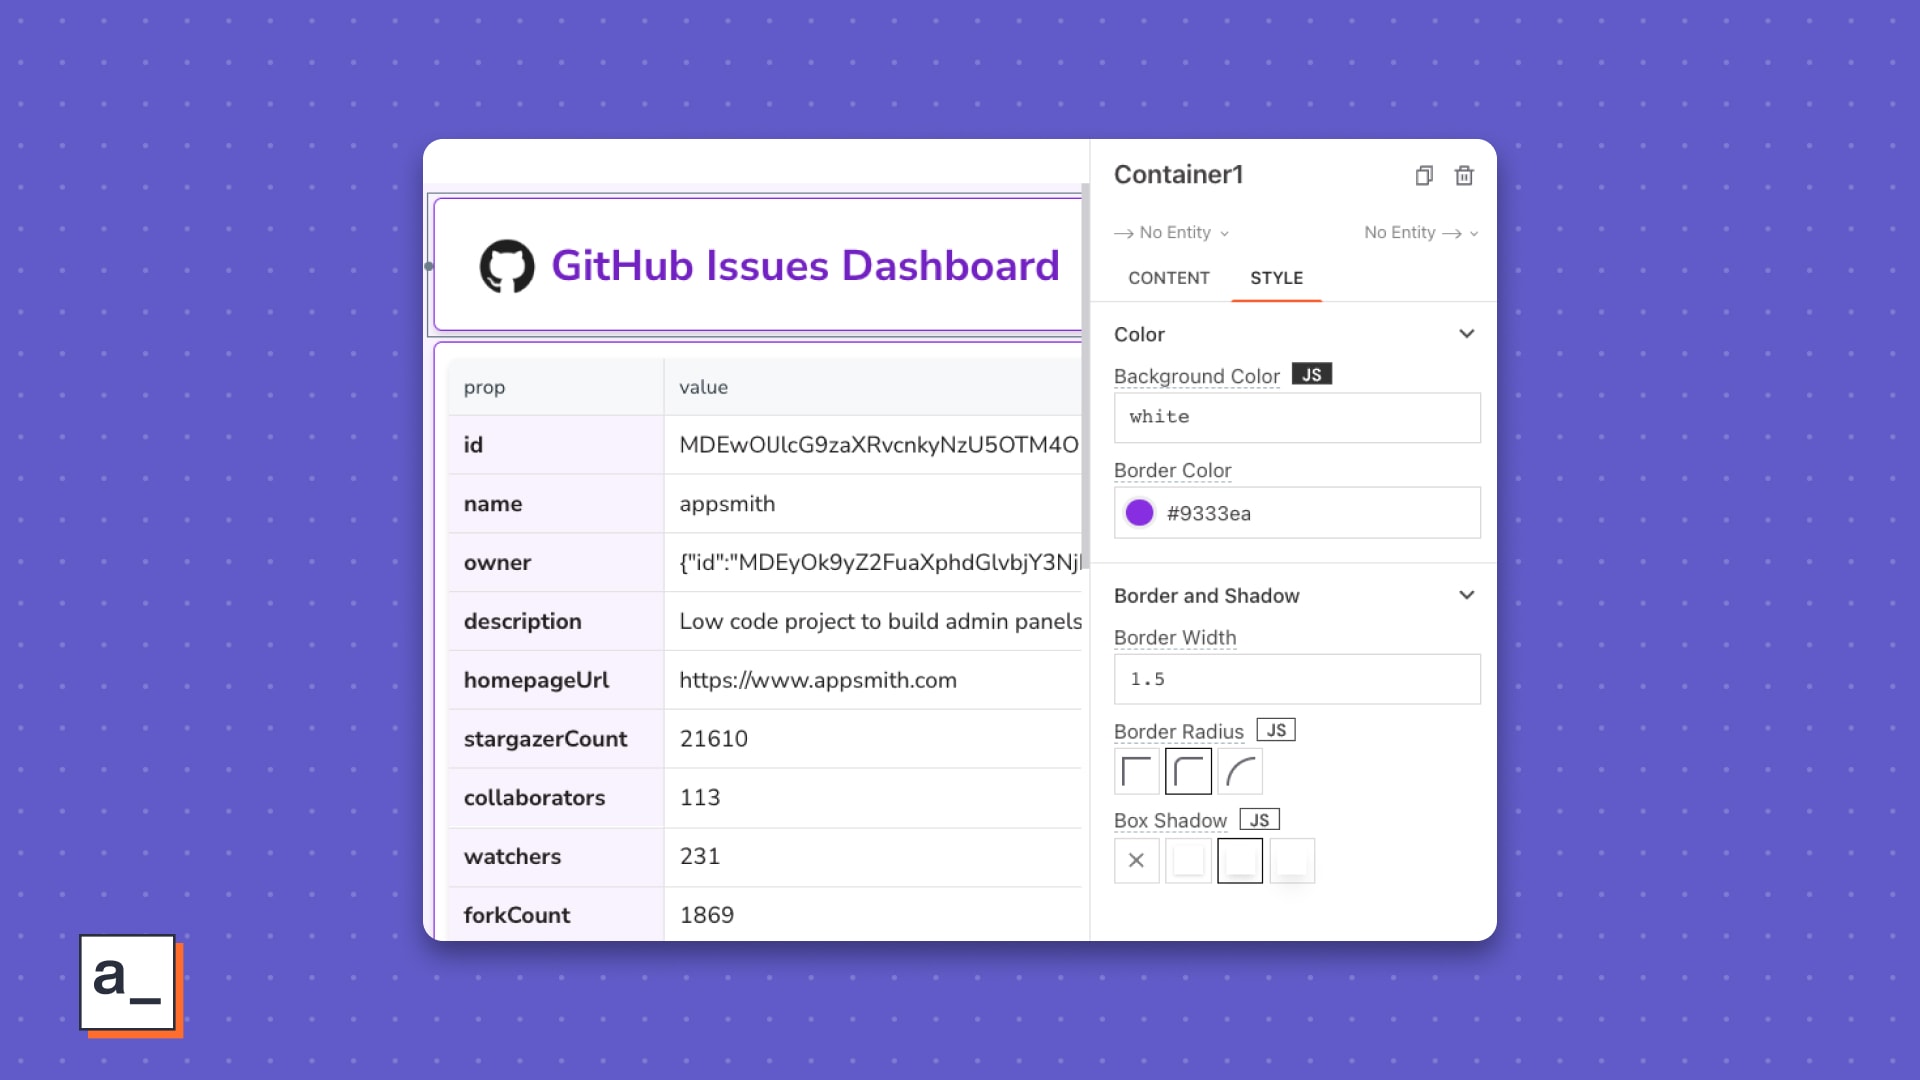
So, you now have an access token from GitHub, a ready GraphQL endpoint plugged into Appsmith, JavaScript-transformed data, and a pretty decent UI for it. ! And we're not even 15 minutes in!
In part two, you will build the Issues Dashboard with a breakdown of issues by type over a time period of your choice, get issues with the most comments, and more.
Stay tuned.